
Page 49 - AN-2-4
P. 49
Advanced Neurology Genomic insights into Alzheimer
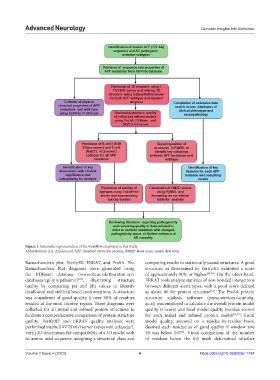
Figure 1. Schematic representation of the workflow employed in this study.
Abbreviations: AA: Amino acid; APP: Amyloid precursor protein; RMSD: Root mean square deviation.
Ramachandran plot, Verify3D, ERRAT, and ProSA. The comparing results to statistically sound structures. A good
Ramachandran Plot diagrams were generated using structure, as determined by Verify3D, exhibited a score
the PDBsum database (www.ebi.ac.uk/thornton-srv/ of approximately 90% or higher [29,30] . On the other hand,
databases/cgi-bin/pdbsum/) , illustrating structure ERRAT tools analyze statistics of non-bonded interactions
[28]
quality by comparing psi and phi values to identify between different atom types, with a good score defined
[31]
disallowed and stable/allowed conformations. A structure as above 80 for protein structure . The ProSA protein
was considered of good quality if over 90% of residues structure analysis software (prosa.services.came.sbg.
resided in the most favored region. These diagrams were ac.at) was employed to calculate the overall protein model
collected for all initial and refined protein structures to quality (z-score) and local model quality (residue scores)
facilitate a comprehensive comparison of protein structure for each initial and refined protein model [32,33] . Local
quality. Verify3D and ERRAT quality analyses were model quality, assessed on a residue-by-residue basis,
performed via the SAVES v6.0 server (saves.mbi.ucla.edu/). deemed each residue as of good quality if window size
Verify3D determines the compatibility of a 3D model with 40 was below 0.0 . Visual comparison of the number
[32]
its amino acid sequence, assigning a structural class and of residues below the 0.0 mark determined whether
Volume 2 Issue 4 (2023) 4 https://doi.org/10.36922/an.1734