
Page 53 - AN-2-4
P. 53
Advanced Neurology Genomic insights into Alzheimer
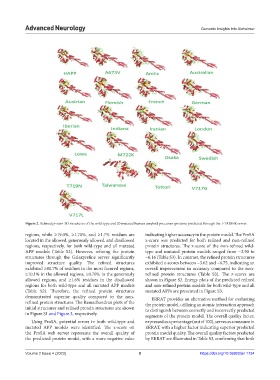
Figure 2. Refined protein 3D structures of the wild-type and 20 mutated human amyloid precursor proteins predicted through the I-TASSER server.
regions, while ≥19.0%, ≥1.70%, and ≥1.7% residues are indicating higher accuracy in the protein model. The ProSA
located in the allowed, generously allowed, and disallowed z-score was predicted for both refined and non-refined
regions, respectively, for both wild-type and all mutated protein structures. The z-score of the non-refined wild-
APP models (Table S2). However, refining the protein type and mutated protein models ranged from −2.50 to
structures through the Galaxyrefine server significantly −6.16 (Table S3). In contrast, the refined protein structures
improved structure quality. The refined structures exhibited z-scores between −3.62 and −6.75, indicating an
exhibited ≥80.7% of residues in the most favored regions, overall improvement in accuracy compared to the non-
≥10.1% in the allowed regions, ≥0.70% in the generously refined protein structures (Table S3). The z-scores are
allowed regions, and ≥1.6% residues in the disallowed shown in Figure S2. Energy plots of the predicted refined
regions for both wild-type and all mutated APP models and non-refined protein models for both wild-type and all
(Table S2). Therefore, the refined protein structures mutated APPs are presented in Figure S3.
demonstrated superior quality compared to the non- ERRAT provides an alternative method for evaluating
refined protein structures. The Ramachandran plots of the the protein model, utilizing an atomic interaction approach
initial structures and refined protein structures are shown to distinguish between correctly and incorrectly predicted
in Figure S1 and Figure 3, respectively. segments of the protein model. The overall quality factor,
Using ProSA, potential errors in both wild-type and expressed as a percentage (out of 100), serves as a measure in
mutated APP models were identified. The z-score on ERRAT, with a higher factor indicating superior predicted
the ProSA web server represents the overall quality of protein model quality. The overall quality factors predicted
the predicted protein model, with a more negative value by ERRAT are illustrated in Table S3, confirming that both
Volume 2 Issue 4 (2023) 8 https://doi.org/10.36922/an.1734