
Page 111 - AN-3-1
P. 111
Advanced Neurology MNS in patients with anxiety and depressive symptoms
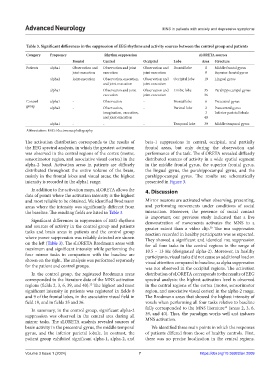
Table 3. Significant differences in the suppression of EEG rhythms and activity sources between the control group and patients
Category Frequency Rhythm suppression sLORETA sources
Frontal Central Occipital Lobe Area Structure
Patients alpha1 Observation and Observation and joint Observation and Frontal lobe 8 Middle frontal gyrus
joint execution execution joint execution 9 Superior frontal gyrus
alpha2 Joint execution Observation, execution, Observation and Occipital lobe 19 Lingual gyrus
and joint execution joint execution
alpha1 - Observation and joint Observation and Limbic lobe 35 Parahippocampal gyrus
execution joint execution 36
Control alpha1 - Observation - Frontal lobe 6 Precentral gyrus
group alpha2 - Observation, - Parietal lobe 2 Postcentral gyrus
imagination, execution, 3 Inferior parietal lobule
and joint execution 40
alpha1 - - - Temporal lobe 39 Middle temporal gyrus
Abbreviation: EEG: Electroencephalography.
The activation distribution corresponds to the results of beta-1 suppressions in central, occipital, and partially
the EEG spectral analysis, in which the greatest activation frontal areas, but only during the observation and
was observed in the central regions of the cortex (motor, performance of the task. The sLORETA revealed diffusely
sensorimotor region, and associative visual cortex) in the distributed sources of activity in a wide spatial segment
alpha-2 band. Activation areas in patients are diffusely in the middle frontal gyrus, the superior frontal gyrus,
distributed throughout the entire volume of the brain, the lingual gyrus, the parahippocampal gyrus, and the
mainly in the frontal lobes and visual areas; the highest parahippocampal gyrus. The results are schematically
intensity is recorded in the alpha1 range. presented in Figure 3.
In addition to the activation maps, sLORETA allows the 4. Discussion
data of points where the activation intensity is the highest
and most reliable to be obtained. We identified Brodmann Mirror neurons are activated when observing, presenting,
areas where the intensity was significantly different from and performing movements under conditions of social
the baseline. The resulting fields are listed in Table 3. interaction. Moreover, the presence of social contact
is important; our previous study indicated that a live
Significant differences in suppression of EEG rhythms demonstration of movements activates the MNS to a
and sources of activity in the control group and patients greater extent than a video clip. The mu suppression
50
tasks and brain areas in patients and the control group reaction recorded in healthy participants was as expected.
where power suppression was reliably detected are shown They showed a significant and identical mu suppression
on the left (Table 3). The sLORETA Brodmann areas with for all four tasks in the central regions in the range of
maximum and significant intensity while performing the 10.5 – 13 Hz (designated alpha-2). Moreover, in healthy
four mirror tasks in comparison with the baseline are participants, visual tasks did not cause an additional load on
shown on the right. The analysis was performed separately visual attention compared to baseline, as alpha suppression
for the patient and control groups. was not observed in the occipital regions. The activation
In the control group, the registered Brodmann areas distribution of sLORETA corresponds to the results of EEG
corresponded to the literature data of the MNS activation spectral analysis: the highest activation level is observed
regions (fields 2, 3, 6, 39, and 40). The highest and most in the central regions of the cortex (motor, sensorimotor
12
significant intensity in patients was registered in fields 8 region, and associative visual cortex) in the alpha-2 range.
and 9 of the frontal lobes, in the associative visual field in The Brodmann areas that showed the highest intensity of
field 19, and in fields 35 and 36. voxels when performing all four tasks relative to baseline
12
In summary, in the control group, significant alpha-2 fully corresponded to the MNS literature (areas 2, 3, 6,
suppression was observed in the central area during all 39, and 40). Thus, the paradigm works well and induces
mirror tasks. The sLORETA analysis revealed sources of MNS activation.
brain activity in the precentral gyrus, the middle temporal We identified three main points in which the responses
gyrus, and the inferior parietal lobule. In contrast, the of patients differed from those of healthy controls. First,
patient group exhibited significant alpha-1, alpha-2, and there was no precise localization in the central regions.
Volume 3 Issue 1 (2024) 7 https://doi.org/10.36922/an.2009