
Page 78 - AN-3-2
P. 78
Advanced Neurology Neuropathy-reduced balance and gait
electrode (Trigno Wireless EMG System, Delsys Inc., USA) M- and H-waves, with maximum amplitude measured
was placed on the lateral gastrocnemius of the participant’s from peak to peak. Typically, the M-wave displays a gradual
declared dominant leg (kicking leg), as recommended increase in amplitude, while the H-wave exhibits a gradual
by SENIAM (2020). Previous findings from our research increase in amplitude followed by a plateau. The intensity
17
indicated that measuring H-reflex from this muscle yielded at which the maximum H-wave occurred determined the
greater reliability compared to other triceps surae muscles latency period.
during both standing and walking among older adults with Postural control was assessed using an Accusway force
PN. Before electrode placement, the skin was cleaned plate (AMTI, USA), with data collected at a sampling rate
24
with an alcohol prep pad and shaved with a disposable of 1000 Hz using AMTI Netforce software. Participants
razor, if necessary. After the EMG surface electrodes stood with their heels 10 cm apart and feet abducted by
were placed, a 5 cm × 8 cm anode and a 2 cm-diameter 10° for 30 s with eyes open. Postural control variables
23
cathode were placed over the patella and popliteal fossa, included the standard deviation of the COP movement
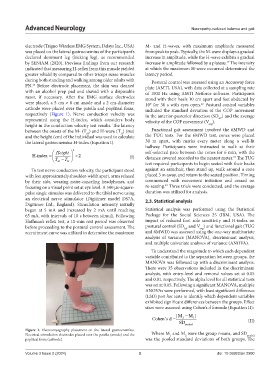
respectively (Figure 1). Nerve conduction velocity was in the anterior-posterior direction (SD ) and the average
represented using the H-index, which considers body velocity of the COP movement (V ). AP
height in the conduction velocity test results. The latency avg
between the onsets of the M- (T ) and H-wave (T ) (ms) Functional gait assessment involved the 6MWD and
M
H
and the height (cm) of the individual was used to calculate the TUG tests. For the 6MWD test, cones were placed
the lateral gastrocnemius H-index (Equation I). 30 m apart, with marks every meter along a well-lit
hallway. Participants were instructed to walk at their
Height 2 self-selected pace between the cones for 6 min, with the
H-index = × 2 (I) distance covered recorded to the nearest meter. The TUG
23
T M −T H
test required participants to begin seated with their backs
To test nerve conduction velocity, the participant stood against an armchair, then stand up, walk around a cone
with feet approximately shoulder-width apart, arms relaxed placed 3 m away, and return to the seated position. Timing
by their side, wearing noise-canceling headphones, and commenced with movement initiation and ceased on
23
focusing on a visual point set at eye level. A 500 µs-square- re-seating. Three trials were conducted, and the average
pulse single stimulus was delivered to the tibial nerve using duration was utilized for analysis.
an electrical nerve stimulator (Digitimer model DS7A, 2.3. Statistical analysis
Digitimer Ltd., England). Stimulation intensity initially
began at 5 mA and increased by 2 mA until reaching Statistical analysis was performed using the Statistical
65 mA, with intervals of 10 s between stimuli. Following Package for the Social Sciences 25 (IBM, USA). The
Hoffman’s reflex test, a 10-min rest period was observed impact of reduced foot sole sensitivity and H-index on
before proceeding to the postural control assessment. The postural control (SD and V ) and functional gait (TUG
avg
AP
recruitment curve was utilized to determine the maximum and 6MWD) was assessed using the one-way multivariate
analysis of variance (MANOVA), discriminant analysis,
and multiple univariate analyses of variance (ANOVA).
To understand the magnitude to which each dependent
variable contributed to the separation between groups, the
MANOVA was followed up with a discriminant analysis.
There were 35 observations included in the discriminant
analysis, with entry-level and removal values set at 0.05
and 0.01, respectively. The alpha level for all statistical tests
was set at 0.05. Following a significant MANOVA, multiple
ANOVAs were performed, with least significant difference
(LSD) post hoc tests to identify which dependent variables
exhibited significant differences between the groups. Effect
sizes were assessed using Cohen’s d formula (Equation II):
|M − M |
Cohen’s d = 2 1 (II)
SD pooled
Figure 1. Electromyography placement on the lateral gastrocnemius.
Electrical stimulation electrodes placed over the patella (anode) and the Where M and M were the group means, and SD pooled
1
2
popliteal fossa (cathode). was the pooled standard deviations of both groups. The
Volume 3 Issue 2 (2024) 3 doi: 10.36922/an.2900