
Page 80 - AN-3-2
P. 80
Advanced Neurology Neuropathy-reduced balance and gait
Table 2. Results of discriminant function analysis
Variables Correlation coefficients with
linear discriminant function 1
Vavg 0.816*
6MWD 0.498*
TUG −0.459*
SDAP −0.192
Notes: Wilks’s lambda=0.635; P=0.086; *denotes significant
contributors.
Abbreviations: 6MWD: 6-min walk distance; SD : Standard deviation
AP
of the center of pressure movement in the anterior-posterior direction;
TUG: Timed-up-and-go; V Average velocity of the center of pressure
avg:
movement.
Table 3. Linear relationship between functional gait and
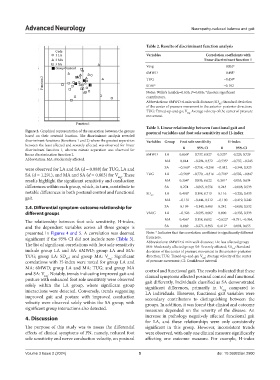
Figure 2. Graphical representation of the separation between the groups postural variables and foot sole sensitivity and H‑index
based on their centroid location. The discriminant analysis revealed
discriminant functions (functions 1 and 2) where the greatest separation Variables Group Foot sole sensitivity H‑index
between the least affected and severely affected was observed for linear
discriminant function 1, whereas minute separation was observed for R 95% CI R 95% CI
linear discrimination function 2. 6MWD LA 0.860* 0.737, 0.927 0.523* 0.229, 0.729
Abbreviation: MA: Moderately affected. MA 0.044 −0.294, 0.372 −0.535* −0.737, −0.245
were observed for LA and SA (d = 0.888) for TUG, LA and SA −0.569* −0.758, −0.290 −0.012 −0.344, 0.323
SA (d = 1.291), and MA and SA (d = 0.803) for V . These TUG LA −0.588* −0.770, −0.316 −0.716* −0.502, −0.847
avg
results highlight the significant sensitivity and conduction MA 0.364* 0.036, 0.622 0.381* 0.055, 0.634
differences within each group, which, in turn, contribute to SA 0.274 −0.065, 0.556 0.243 −0.098, 0.533
notable differences in both postural control and functional SD LA 0.498* 0.198, 0.713 0.116 −0.226, 0.433
gait. AP MA −0.131 −0.444, 0.212 −0.100 −0.419, 0.242
3.4. Differential symptom-outcome relationship for SA 0.199 −0.143, 0.499 0.242 −0.099, 0.532
different groups VAVG LA −0.326 −0.595, 0.007 0.000 −0.333, 0.333
The relationship between foot sole sensitivity, H-index, MA 0.466* 0.158, 0.692 −0.622* −0.791, −0.364,
and the dependent variables across all three groups is SA 0.069 −0.271, 0.393 0.412* 0.091, 0.655
presented in Figures 4 and 5. A correlation was deemed Note: * Indicates that the correlation coefficient is significantly different
significant if the 95% CI did not include zero (Table 3). from zero.
The list of significant correlations with foot sole sensitivity Abbreviations: 6MWD: 6-min walk distance; LA: less affected group;
MA: Moderately affected group; SA: Severely affected; SD : Standard
AP
include group LA and SA: 6MWD; group LA and MA: deviation of the center of pressure movement in the anterior-posterior
TUG; group LA: SD ; and group MA: V . Significant direction; TUG: Timed-up-and-go; V : Average velocity of the center
avg
avg
AP
correlations with H-index were noted for group LA and of pressure movement; CI: Confidence interval.
MA: 6MWD; group LA and MA: TUG; and group MA control and functional gait. The results indicated that these
and SA: V . Notably, trends indicating improved gait and clinical symptoms affected postural control and functional
avg
posture with enhanced foot sole sensitivity were observed gait differently. Individuals classified as SA demonstrated
solely within the LA group, where significant group significant differences, primarily in V compared to
interactions were detected. Conversely, trends suggesting LA individuals. However, functional gait variables were
avg
improved gait and posture with improved conduction secondary contributors to distinguishing between the
velocity were observed solely within the SA group, with groups. In addition, it was found that clinical and outcome
significant group interactions also detected. measures depended on the severity of the disease. An
4. Discussion increase in pathology negatively affected functional gait
for LA, and these relationships were only consistently
The purpose of this study was to assess the differential significant in this group. However, inconsistent trends
effects of clinical symptoms of PN, namely, reduced foot were observed, with only one clinical measure significantly
sole sensitivity and nerve conduction velocity, on postural affecting one outcome measure. For example, H-index
Volume 3 Issue 2 (2024) 5 doi: 10.36922/an.2900