
Page 81 - AN-3-2
P. 81
Advanced Neurology Neuropathy-reduced balance and gait
A B C D E
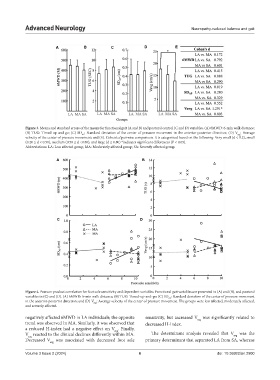
Figure 3. Means and standard errors of the means for functional gait (A and B) and postural control (C and D) variables. (A) 6MWD: 6-min walk distance;
(B) TUG: Timed-up-and-go; (C) SD : Standard deviation of the center of pressure movement in the anterior-posterior direction; (D) V : Average
AP
avg
velocity of the center of pressure movement; and (E). Cohen’s d pairwise comparison. It is categorized based on the following: Very small (d < 0.2), small
(0.20 ≤ d < 0.50), medium (0.50 ≤ d <0.80), and large (d ≤ 0.80) *indicates significant differences (P < 0.05).
Abbreviations: LA: Less affected group; MA: Moderately affected group; SA: Severely affected group.
A B
C D
Figure 4. Pearson product correlation for foot sole sensitivity and dependent variables. Functional gait variables are presented in (A) and (B), and postural
variables in (C) and (D). (A) 6MWD: 6-min walk distance; (B) TUG: Timed-up-and-go; (C) SD : Standard deviation of the center of pressure movement
AP
in the anterior-posterior direction; and (D) V : Average velocity of the center of pressure movement. The groups were less affected, moderately affected,
avg
and severely affected.
negatively affected 6MWD in LA individuals; the opposite sensitivity, but increased V was significantly related to
avg
trend was observed in MA. Similarly, it was observed that decreased H-index.
a reduced H-index had a negative effect on V . Finally,
avg
V reacted to the clinical declines differently within MA. The determinant analysis revealed that V was the
avg
avg
Decreased V was associated with decreased foot sole primary determinant that separated LA from SA, whereas
avg
Volume 3 Issue 2 (2024) 6 doi: 10.36922/an.2900