
Page 139 - AN-3-3
P. 139
Advanced Neurology Rare manifestation in nemaline myopathy
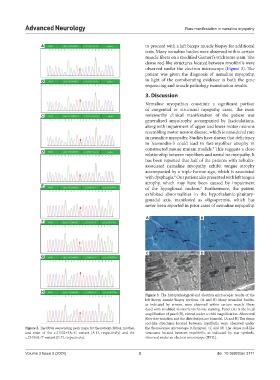
A to proceed with a left biceps muscle biopsy for additional
tests. Many nemaline bodies were observed within certain
muscle fibers on a modified Gomori’s trichrome stain. The
dense rod-like structures located between myofibrils were
observed under the electron microscope (Figure 3). The
patient was given the diagnosis of nemaline myopathy,
B in light of the corroborating evidence in both the gene
sequencing and muscle pathology examination results.
3. Discussion
Nemaline myopathies constitute a significant portion
of congenital or structural myopathy cases. The most
C noteworthy clinical manifestation of the patient was
generalized amyotrophy accompanied by fasciculations,
along with impairment of upper and lower motor neurons
resembling motor neuron disease, which is considered rare
in nemaline myopathy. Studies have shown that deficiency
in leiomodin-3 could lead to fast-myofiber atrophy in
constructed mouse mutant models. This suggests a close
5
D
relationship between myofibers and nemaline myopathy. It
has been reported that half of the patients with nebulin-
associated nemaline myopathy exhibit tongue atrophy
accompanied by a triple furrow sign, which is associated
with dysphagia. Our patient also presented with left tongue
6
atrophy, which may have been caused by impairment
E
of the hypoglossal nucleus. Furthermore, the patient
6
exhibited abnormalities in the hypothalamic-pituitary-
gonadal axis, manifested as oligospermia, which has
never been reported in prior cases of nemaline myopathy.
A B
F
C D
G
H
Figure 3. The histopathological and electron microscopic results of the
left biceps muscle biopsy sections. (A and B) Many nemaline bodies,
as indicated by arrows, were observed within certain muscle fibers
dyed with modified Gomori’s trichrome staining. Panel (A) is the local
amplification of panel (B), viewed under a ×400 magnification. Abnormal
fiber size variation and the distribution are bimodal. (A and B) The dense
rod-like structures located between myofibrils were observed under
Figure 2. The DNA sequencing peak maps for the patient, father, mother, the fluorescence microscope (Olympus). (C and D) The dense rod-like
and sister of the c.21522+3A>G variant (A-D, respectively) and the structures located between myofibrils, as indicated by star symbols,
c.23455A>T variant (E-H, respectively). observed under an electron microscope (JEOL).
Volume 3 Issue 3 (2024) 3 doi: 10.36922/an.3171