
Page 66 - AN-3-4
P. 66
Advanced Neurology Cognition in children with mild TBI
Table 3. Results of Developmental Neuropsychology
Assessment (NEPSY‑II) in a group of children with
traumatic brain injury collected in the post‑acute phase (T1)
and at the end of the follow‑up period (T2)
Item T1 T2 P*
Mean SD Mean SD
A1 visual attention 8.6 3.5 8.7 3.6 0.916
A3 auditory attention 8.3 4.2 9.1 4.2 0.459
A4 inhibition A 9.2 2.6 9.6 3.1 0.995
A4k inhibition B 9.9 3.0 9.5 2.8 0.297
M3 memory for design 6.6 3.7 6.8 3.7 0.774
M3 memory for design (delayed) 7.5 3.9 7.2 3.5 0.703
M6 narrative memory total 8.4 3.1 8.4 3.0 0.993
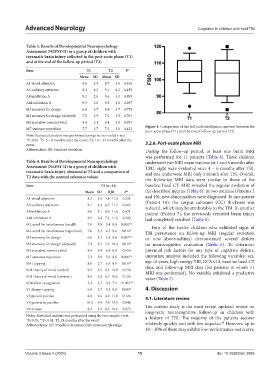
Figure 4. Comparison of the full-scale intelligence quotient between the
M7 sentence repetition 7.7 3.7 7.2 3.0 0.423
post-acute phase (T1) and the end of follow-up period (T2)
Note: Statistical analysis was performed using the two-tailed t-test.
*P<0.05. T1: 3 – 6 months after the event; T2: 18 – 24 months after the
event. 3.2.6. Post-acute phase MRI
Abbreviation: SD: Standard deviation. During the follow-up period, at least one brain MRI
was performed for 11 patients (Table 6). Three children
Table 4. Results of Developmental Neuropsychology underwent two MRI examinations (at 1 and 6 months after
Assessment (NEPSY‑II) in a group of children with TBI), eight were evaluated once 4 – 6 months after TBI,
traumatic brain injury obtained at T2 and a comparison of and one underwent MRI only 1 month after TBI. Overall,
T2 data with the normal reference values
the follow-up MRI data were similar to those of the
Item T2 (n=14) baseline head CT. MRI revealed the regular evolution of
Mean SD IQR P* the described injuries (Table 6). In two patients (Patients 2
A1 visual attention 8.7 3.6 5.8–11.3 0.221 and 10), new abnormalities were diagnosed. In one patient
A3 auditory attention 9.1 4.2 6.5–11.7 0.465 (Patient 10), the corpus callosum (CC) thickness was
reduced, which may be attributable to the TBI. In another
A4 inhibition A 9.6 3.1 8.0–11.6 0.671 patient (Patient 7), the previously reported brain injury
A4k inhibition B 9.5 2.8 7.3–11.3 0.583 had completely resolved (Table 5).
M2 word list interference (recall) 7.0 3.0 5.4–9.0 0.002** Four of the twelve children who exhibited signs of
M2 word list interference (repetition) 7.6 3.3 6.5–9.6 0.012* TBI persistence on follow-up MRI (regular evolution
M3 memory for design 6.8 3.7 5.1–9.6 0.007** or new abnormalities) demonstrated several deficits
M3 memory for design (delayed) 7.2 3.5 5.3–10.4 0.011* on neurocognitive evaluation (Table 6). To determine
M6 narrative memory total 8.4 3.0 6.9–8.0 0.054 potential risk factors for any type of cognitive deficits,
M7 sentence repetition 7.2 3.0 5.6–9.6 0.006** univariate analysis included the following variables: sex,
SM1 tapping 8.0 2.7 6.3–9.9 0.011* age <6 years, high energy TBI, GCS ≤14, baseline head CT
SO1 theory of mind (verbal) 9.5 3.5 8.5–12.0 0.559 data, and follow-up MRI data (for patients in whom >1
MRI was performed). No variable exhibited a predictive
SO1 theory of mind (context.) 8.8 2.8 6.7–10.6 0.126
value (Table 7).
SO4 affect recognition 5.2 2.7 3.3–7.3 <0.001**
V1 design copying 6.8 2.7 5.5–9.0 0.001* 4. Discussion
V3 picture puzzles 8.8 2.6 6.9–11.0 0.126 4.1. Literature review
V4 geometric puzzles 10.3 4.0 7.0–13.4 0.646
V6 arrows 8.3 3.2 6.3–10.6 0.073 The current study is the most recent updated review on
long-term neurocognitive follow-up in children with
Notes: Statistical analysis was performed using the one-sample t-test. a history of TBI. The majority of the patients recover
*P<0.05; **P<0.01. T2: 24 months after the event.
48
Abbreviations: SD: Standard deviation; IQR: Interquartile range. relatively quickly and with few sequelae. However, up to
10 – 30% of them may exhibit low-performance test scores,
Volume 3 Issue 4 (2024) 15 doi: 10.36922/an.3886