
Page 106 - AN-4-1
P. 106
Advanced Neurology TDP-43 regulates IFN1 production
A B
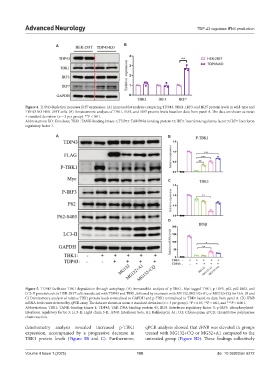
Figure 4. TDP43 depletion increases IRF7 expression. (A) Immunoblot analysis comparing TDP43, TBK1, IRF3, and IRF7 protein levels in wild-type and
TDP43 KO HEK-293T cells. (B) Densitometric analysis of TBK1, IRF3, and IRF7 protein levels based on data from panel A. The data are shown as mean
± standard deviation (n = 3 per group). **P < 0.01.
Abbreviations: KO: Knockout; TBK1: TANK-binding kinase 1; TDP43: TAR DNA-binding protein 43; IRF3: Interferon regulatory factor 3; IRF7: Interferon
regulatory factor 7.
A B
C
D
Figure 5. TDP43 facilitates TBK1 degradation through autophagy. (A) Immunoblot analysis of p-TBK1, Myc-tagged TBK1, p-IRF3, p62, p62-S403, and
LC3-II protein levels in HEK-293T cells transfected with TDP43 and TBK1, followed by treatment with MG132, MG132+A1, or MG132+CQ for 16 h. (B and
C) Densitometry analysis of relative TBK1 protein levels normalized to GAPDH and p-TBK1 normalized to TBK1 based on data from panel A. (D) IFNB
mRNA levels were detected by qPCR assay. The data are shown as mean ± standard deviation (n = 3 per group). *P < 0.05, **P < 0.01, and ***P < 0.001.
Abbreviations: TBK1: TANK-binding kinase 1; TDP43: TAR DNA-binding protein 43; IRF3: Interferon regulatory factor 3; p-IRF3: phosphorylated-
interferon regulatory factor 3; LC3-II: Light chain 3-II; IFNB: Interferon beta; A1: Bafilomycin A1; CQ: Chloroquine; qPCR: Quantitative polymerase
chain reaction.
densitometry analysis revealed increased p-TBK1 qPCR analysis showed that IFNB was elevated in groups
expression, accompanied by a progressive decrease in treated with MG132+CQ or MG32+A1 compared to the
TBK1 protein levels (Figure 5B and C). Furthermore, untreated group (Figure 5D). These findings collectively
Volume 4 Issue 1 (2025) 100 doi: 10.36922/an.6272