
Page 69 - AN-4-3
P. 69
Advanced Neurology Brain regions in olfactory dysfunction in PD
which is critical for consistent results across all scans. In variables were analyzed through the chi-squared test.
addition, earplugs were provided to reduce the effects of The Spearman correlation coefficient was employed to
excessive scanner noise, which often reaches levels that can assess the association between the variables. A p<0.05 was
be uncomfortable for patients. The loud sounds produced deemed statistically significant.
during MRI scanning can lead to anxiety and involuntary
movements, potentially compromising image quality. By 3. Results
using earplugs, we aimed to enhance patient comfort and 3.1. Characteristics of the participants
cooperation during the procedure.
The analysis included a total of 23 PD-NS, 69 PD-SD, and 92
To further enhance stability during the MRI session, HCs. The demographic and clinical profiles of these three
firm foam pads were used around the patient’s head. These groups are detailed in Table 1. Age and gender exhibited
pads served to restrict movement and help maintain the no significant differences between the HC and PD groups
participants’ heads in a fixed position, which is vital for (p>0.05). No significant difference was observed in disease
acquiring high-quality images. Even slight head movements duration, medication administration status, educational
can result in image blurring, making it difficult to analyze level, and disease severity (between PD-NS and PD-SD)
the resultant data accurately. The use of these foam pads, (p>0.05). The results of the ISIT tests exhibited strong and
therefore, contributes significantly to the overall quality of significant differences between the means of the HC and
the imaging process. PD groups. The ISIT scores for HC, PD-NS, and PD-SD,
The MRI sequences utilized in this study included respectively, are 21.50, 19.50, and 11.40 (p<0.001).
T1-weighted images, which are particularly effective The present study also compared the mean scores for
for assessing anatomical structures within the brain. drug types, family history (PD patients with first-degree
T1-weighted imaging is optimal for visualizing GM, relatives affected by the disease), first sign of the disease,
WM, and the overall structure of the brain. The imaging smoking status, accommodation status, the Montreal
parameters for the T1 sequences were set to a voxel size of Cognitive Assessment, blood types, and weights among
1.2 mm × 1.0 mm × 5.5 mm, which allows for a balance the PD groups, revealing no significant differences between
between spatial resolution and acquisition efficiency. This the groups (p>0.05).
voxel size enables the differentiation of various brain tissues
while ensuring that the scan duration remains manageable 3.2. Comparison of the GMV between the PD patient
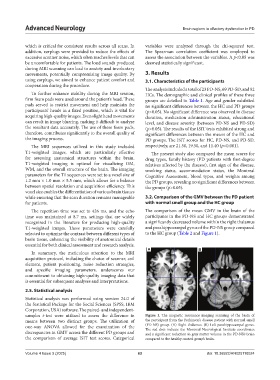
for patients. with normal smell group and the HC group
The repetition time was set to 426 ms, and the echo The comparison of the mean GMV in the brain of the
time was maintained at 8.7 ms, settings that are widely participants in the PD-NS and HC groups demonstrated
recognized in the literature for producing high-quality a significantly decreased volume within the right thalamus
T1-weighted images. These parameters were carefully and parahippocampal gyrus of the PD-NS group compared
selected to optimize the contrast between different types of to the HC group (Table 2 and Figure 1).
brain tissue, enhancing the visibility of anatomical details
essential for both clinical assessment and research analysis.
A B
In summary, the meticulous attention to the MRI
acquisition protocol, including the choice of scanner, coil
element, patient positioning, noise reduction strategies,
and specific imaging parameters, underscores our
commitment to obtaining high-quality imaging data that
is essential for subsequent analyses and interpretations.
2.5. Statistical analysis
Statistical analysis was performed using version 24.0 of
the Statistical Package for the Social Sciences (SPSS, IBM
Corporation, USA) software. The paired- and independent-
samples t-test were utilized to assess the difference in Figure 1. The magnetic resonance imaging scanning of the brain of
means between two distinct groups. The utilization of the participant from the Parkinson’s disease patient with normal smell
one-way ANOVA allowed for the examination of the (PD-NS) group. (A) Right thalamus. (B) Left parahippocampal gyrus.
The red dots indicate the Montreal Neurological Institute coordinates
discrepancies in GMV across the different PD groups and and a significant reduction in gray matter volume in the PD-NS’s brain
the comparison of average ISIT test scores. Categorical compared to the healthy control group’s brain.
Volume 4 Issue 3 (2025) 63 doi: 10.36922/AN025110024