
Page 70 - AN-4-3
P. 70
Advanced Neurology Brain regions in olfactory dysfunction in PD
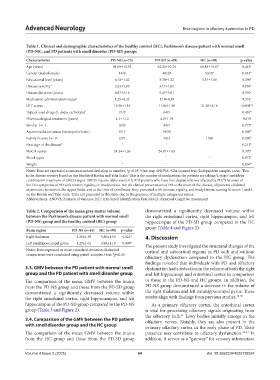
Table 1. Clinical and demographic characteristics of the healthy control (HC), Parkinson’s disease patient with normal smell
(PD‑NS), and PD patients with smell disorder (PD‑SD) groups
Characteristics PD‑NS (n=23) PD‑SD (n=69) HC (n=90) p‑value
Age (years) 61.09±10.35 62.32±10.76 60.83±10.07 0.445 a
Gender (male/female) 14/9 40/29 53/37 0.432 b
Educational level (years) 4.18±1.42 3.30±1.22 3.31±1.49 0.390 a
Disease severity d 2.62±1.03 3.17±1.05 - 0.036 c
Disease duration (years) 4.87±3.16 5.47±3.01 - 0.550 c
Medication administration status e 1.25±0.32 1.18±0.38 - 0.552 c
ISIT scores 19.50±1.16 11.40±1.30 21.50±1.16 <0.001 *
a
Type of used drugs (L-dopa-carbidopa) f 21/2 64/5 - 0.439 b
Pharmacological treatment (years) 4.1±1.12 4.3±1.19 - 0.419
Smoker (+/-) 3/20 4/65 - 0.772 b
Accommodation status (metropolis/town) 8/15 19/50 - 0.390 b
Family history (+/-) g 2/21 7/62 1/89 0.590 b
First sign of the disease h i i - 0.213 b
MoCA scores 24.34±1.26 24.07±1.63 - 0.370 c
Blood types i i i 0.872 b
Weight i i i 0.654 b
b
a
c
d
Notes: Data are expressed as mean±standard deviation or number; *p<0.05; One-way ANOVA; Chi-squared test; Independent samples t-test; This
is the disease severity based on the Modified Hoehn and Yahr Scale; This is the number of medications the patients are taking; L-dopa-carbidopa
e
f
combination treatment of 250/25 mg or 100/25 mg one tablet every 4 h; PD patients who have first-degree relatives affected by PD; The onset of
g
h
the first symptoms of PD with tremor, rigidity, or bradykinesia. For the clinical presentation of PD at the onset of the disease, all patients exhibited
asymmetric tremors in the upper limbs, and at the time of enrollment, they presented with tremors, rigidity, and bradykinesia, scoring between 1 and 3
on the Hoehn and Yahr scale. Data not presented in this table due to the presence of multiple categorical values.
i
Abbreviations: ANOVA: Analysis of variance; ISIT: Iran Smell Identification Test; MoCA: Montreal Cognitive Assessment.
Table 2. Comparison of the mean gray matter volume demonstrated a significantly decreased volume within
between the Parkinson’s disease patient with normal smell the right entorhinal cortex, right hippocampus, and left
(PD‑NS) group and the healthy control (HC) group hippocampus of the PD-SD group compared to the HC
group (Table 4 and Figure 2).
Brain region PD‑NS (n=16) HC (n=90) p‑value
Right thalamus 5.35±1.39 5.86±1.50 0.021* 4. Discussion
Left parahippocampal gyrus 3.27±1.01 3.99±1.10 0.009*
The present study investigated the structural changes of the
Notes: Data expressed as mean±standard deviation; Statistical cortical and subcortical regions in PD with and without
comparisons were conducted using paired-samples t-test; *p<0.05.
olfactory dysfunction compared to the HC group. The
findings revealed that individuals with PD and olfactory
3.3. GMV between the PD patient with normal smell dysfunction had a reduction in the volume of both the right
group and the PD patient with smell disorder group and left hippocampi and entorhinal cortex in comparison
The comparison of the mean GMV between the brains to those in the PD-NS and HC groups. In addition, the
from the PD-NS group and those from the PD-SD group PD-NS group demonstrated a decrease in the volume of
demonstrated a significantly decreased volume within the right thalamus and left parahippocampal gyrus. These
the right entorhinal cortex, right hippocampus, and left results align with findings from previous studies. 28-30
hippocampus of the PD-SD group compared to the PD-NS As a primary olfactory cortex, the entorhinal cortex
group (Table 3 and Figure 2). is vital for processing olfactory signals originating from
the olfactory bulb. Lewy bodies initially emerge in the
31
3.4. Comparison of the GMV between the PD patient olfactory nerves. Notably, they are also present in the
with smell disorder group and the HC group primary olfactory cortex in the early phase of PD. Their
The comparison of the mean GMV between the brains presence may contribute to olfactory dysfunction. 32-34 In
from the HC group and those from the PD-SD group addition, it serves as a “gateway” for sensory information
Volume 4 Issue 3 (2025) 64 doi: 10.36922/AN025110024