
Page 97 - AN-4-3
P. 97
Advanced Neurology TG100-115 suppresses glioblastoma cell functions
2.7. Statistical analysis progressively over the culture period, reaching 108.0 ± 4.4%,
All data are presented as means ± standard error of the mean. 255.9 ± 5.7%, and 383.8 ± 5.4% at 24, 48, and 72 h, respectively.
Student’s t-test was employed to compare the control and In contrast, treatment with TG100-115 (30 – 240 µM)
treatment groups. One-way analysis of variance, followed by significantly inhibited U251 cell proliferation at 24, 48, and
the Newman–Keuls post hoc test, was utilized to ascertain 72 h, compared to the control group (p<0.001, n = 3). In
statistical significance for multiple comparisons. p<0.05 was Figure S1, numerous U251 cell colonies were observed
considered to indicate a statistically significant difference. in the control group 7 days after seeding in six-well plates,
as indicated by the crystal violet staining. Treatment with
3. Results TG100-115 (50 µM) resulted in a significant reduction in
U251 cell colony formation to 47.0 ± 4.3%, compared to
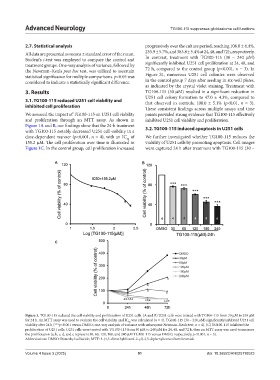
3.1. TG100-115 reduced U251 cell viability and that observed in controls, 100.0 ± 5.1% (p<0.01, n = 3).
inhibited cell proliferation These consistent findings across multiple assays and time
We assessed the impact of TG100-115 on U251 cell viability points provided strong evidence that TG100-115 effectively
and proliferation through an MTT assay. As shown in inhibited U251 cell viability and proliferation.
Figure 1A and B, our findings show that the 24-h treatment
with TG100-115 notably decreased U251 cell viability in a 3.2. TG100-115 induced apoptosis in U251 cells
dose-dependent manner (p<0.001, n = 4), with an IC of We further investigated whether TG100-115 reduces the
50
155.2 µM. The cell proliferation over time is illustrated in viability of U251 cells by promoting apoptosis. Cell images
Figure 1C. In the control group, cell proliferation increased were captured 24 h after treatment with TG100-115 (30 –
A B
C
Figure 1. TG100-115 reduced the cell viability and proliferation of U251 cells. (A and B) U251 cells were treated with TG100-115 from 30 µM to 240 µM
for 24 h. An MTT assay was used to evaluate the cell viability, and IC was calculated (n = 4). TG100-115 (30 – 240 µM) significantly inhibited U251 cell
50
viability after 24 h (***p<0.001 versus DMSO; one-way analysis of variance with subsequent Newman–Keuls test, n = 4). (C) TG100-115 inhibited the
proliferation of U251 cells. U251 cells were treated with TG100-115 from 30 µM to 240 µM for 24, 48, and 72 h, then an MTT assay was used to measure
the proliferation (a, b, c, d, and e represent 30, 60, 120, 180, and 240 µM TG100-115 versus DMSO, respectively, p<0.001, n = 3).
Abbreviations: DMSO: Dimethyl sulfoxide; MTT: 3-(4,5-dimethylthiazol-2-yl)-2,5-diphenyltetrazolium bromide.
Volume 4 Issue 3 (2025) 91 doi: 10.36922/AN025110023