
Page 86 - AN-4-4
P. 86
Advanced Neurology Cytokine response to EV therapy in SCI
MSC-EVs was applied immediately after injury (SCI FM 2.5. Statistical analysis
group: n = 6). In the two experimental groups, 5 and 10 µg Data were analyzed using the Origin Pro software
®
of MSC-EVs encapsulated in 18 µl of FM (Tissucol ; (version 2020 [9.7], OriginLab Corp., USA). Data are
Baxter, USA) were applied immediately after injury (SCI presented as mean values with standard deviation (SD) or
FM+EVs5 group: n = 6; SCI FM+EVs10 group: n = 5). After standard error (SE). A normality test was conducted for
surgery, all rats received daily intramuscular gentamicin all study groups. One-way analysis of variance (ANOVA)
(25 mg/kg; Microgen, Russia) for 7 days. Bladders of followed by Tukey’s test was performed for multiple group
the injured rats were manually emptied twice daily until comparisons. All analyses were performed in a blinded
spontaneous urination was restored. manner relative to the study groups. A value of p<0.05 was
2.4. Multiplex assay considered statistically significant.
To assess the cytokine profiles at 60-day post-injury (dpi), 3. Results
a section of the spinal cord, including the injury epicenter, Cytokine levels in spinal cord homogenates from the four
was dissected at the Th8 level. The tissue was homogenized groups (SCI, SCI FM, SCI FM+EVs5, and SCI FM+EVs10)
using an electric homogenizer in 300 µL of complete at 60 dpi revealed notable differences in the expression
extraction buffer. Following centrifugation at 13,000 rpm patterns. The data obtained through multiplex analysis
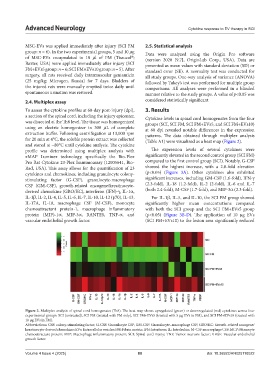
for 20 min at 4°C, the soluble protein extract was collected (Table A1) were visualized as a heat map (Figure 2).
and stored at −80°C until cytokine analysis. The cytokine
profile was determined using multiplex analysis with The expression levels of several cytokines were
xMAP Luminex technology, specifically the Bio-Plex significantly elevated in the second control group (SCI FM)
Pro Rat Cytokine 23-Plex Immunoassay (12005641, Bio- compared to the first control group (SCI). Notably, G-CSF
Rad, USA). This assay allows for the quantification of 23 showed the highest increase, with a 2.8-fold elevation
cytokines and chemokines, including granulocyte colony- (p<0.05) (Figure 3A). Other cytokines also exhibited
stimulating factor (G-CSF), granulocyte-macrophage significant increases, including GM-CSF (1.6-fold), IFN-γ
CSF (GM-CSF), growth-related oncogene/keratinocyte- (2.3-fold), IL-18 (1.2-fold), IL-2 (2-fold), IL-6 and IL-7
derived chemokine (GRO/KC), interferon (IFN)-γ, IL-1α, (both 2.4-fold), M-CSF (1.7-fold), and MIP-3α (2.3-fold).
IL-1β, IL-2, IL-4, IL-5, IL-6, IL-7, IL-10, IL-12 (p70), IL-13, For IL-1β, IL-5, and IL-10, the SCI FM group showed
IL-17A, IL-18, macrophage CSF (M-CSF), monocyte significantly higher mean concentrations compared
chemoattractant protein-1, macrophage inflammatory with both the SCI group and the SCI FM+EVs5 group
protein (MIP)-1α, MIP-3α, RANTES, TNF-α, and (p<0.05) (Figure 3B-D). The application of 10 µg EVs
vascular endothelial growth factor. (SCI FM+EVs10) to the lesion area significantly reduced
Figure 2. Multiplex analysis of spinal cord homogenates (Th8). The heat map shows upregulated (green) or downregulated (red) cytokines across four
experimental groups: SCI (untreated), SCI FM (treated with FM only), SCI FM+EVs5 (treated with 5 µg EVs in FM), and SCI FM+EVs10 (treated with
10 µg EVs in FM).
Abbreviations: CSF: colony-stimulating factor; G-CSF: Granulocyte CSF; GM-CSF: Granulocyte–macrophage CSF; GRO/KC: Growth-related oncogene/
keratinocyte-derived chemokine; EVs: Extracellular vesicles; FM: Fibrin matrix; IFN: Interferon; IL: Interleukin; M-CSF: macrophage CSF; MCP: Monocyte
chemoattractant protein; MIP: Macrophage inflammatory protein; SCI: Spinal cord injury; TNF: Tumor necrosis factor; VEGF: Vascular endothelial
growth factor.
Volume 4 Issue 4 (2025) 80 doi: 10.36922/AN025110022