
Page 26 - ARNM-2-1
P. 26
Advances in Radiotherapy
& Nuclear Medicine Is 5-mm PTV margin 4D-CT-based radiotherapy
(81%). This result implies that in 19% of the patients, the due to tumor or nodal movements during the respiratory
volumes were not at the same anatomical position. Such cycle. DIC has a median value of 0.8 (range: 0.75 – 0.87).
deviations indicate the likelihood of PTV displacement For the purpose of our study, we created two radiotherapy
plans based on FBCT-based volume and another based
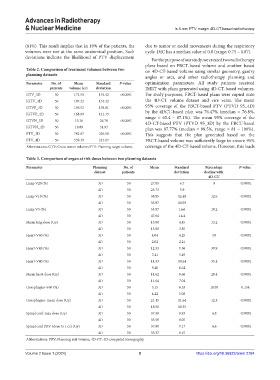
Table 2. Comparison of treatment volumes between two on 4D-CT-based volume using similar geometry, gantry
planning datasets
angles or arcs, and other radiotherapy planning and
Parameter No. of Mean Standard P‑value optimization parameters. All study patients received
patients volume (cc) deviation IMRT with plans generated using 4D-CT-based volumes.
GTV_3D 50 171.55 134.42 <0.0001 For study purposes, FBCT-based plans were copied onto
IGTV_4D 50 187.22 134.42 the 4D-CT volume dataset and vice versa. The mean
GTVP_3D 50 156.52 139.81 <0.0001 95% coverage of the FBCT-based PTV (PTVD 95_4D)
IGTVP_4D 50 168.69 141.15 by the 4DCT-based plan was 76.47% (median = 76.8%,
range = 65.4 – 87.1%). The mean 95% coverage of the
GTVN_3D 50 15.16 26.78 <0.0001 4D-CT-based PTV (PTVD 95_3D) by the FBCT-based
IGTVN_4D 50 18.89 31.93 plan was 97.77% (median = 99.5%, range = 81 – 100%).
PTV_3D 50 781.67 336.58 <0.0001 This suggests that the plan generated based on the
PTV_4D 50 539.39 243.07 FBCT-based volume was sufficiently large to ensure 95%
Abbreviations: GTV: Gross tumor volume; PTV: Planning target volume. coverage of the 4D-CT-based volume. However, this leads
Table 3. Comparison of organ at risk doses between two planning datasets
Parameter Planning No. of Mean Standard Percentage P‑value
dataset patients deviation decline with
4D‑CT
Lung-V20 (%) 3D 50 27.05 6.7 9 <0.0001
4D 50 23.73 5.9
Lung-V10 (%) 3D 50 38.85 12.48 12.6 <0.0001
4D 50 33.97 10.03
Lung-V5 (%) 3D 50 53.07 16.6 10.2 <0.0001
4D 50 47.64 14.4
Mean lung dose (Gy) 3D 50 15.08 4.45 13.2 <0.0001
4D 50 13.09 3.85
Heart-V60 (%) 3D 50 4.04 4.25 50 <0.0001
4D 50 2.02 2.21
Heart-V45 (%) 3D 50 12.33 9.56 39.9 <0.0001
4D 50 7.41 5.49
Heart-V40 (%) 3D 50 14.33 10.64 35.4 <0.0001
4D 50 9.26 6.62
Mean heart dose (Gy) 3D 50 14.62 8.66 20.4 <0.0001
4D 50 11.64 7.04
Oesophagus-V60 (%) 3D 50 5.15 6.53 18.05 0.154
4D 50 4.22 5.08
Oesophagus- mean dose (Gy) 3D 50 21.15 11.64 12.5 <0.0001
4D 50 18.50 10.35
Spinal cord-max dose (Gy) 3D 50 37.39 8.93 4.8 <0.0001
4D 50 35.59 8.05
Spinal cord PRV (dose to 1 cc) (Gy) 3D 50 37.90 9.17 6.6 <0.0001
4D 50 35.37 8.15
Abbreviations: PRV: Planning risk volume; 4D-CT: 4D-computed tomography.
Volume 2 Issue 1 (2024) 5 https://doi.org/10.36922/arnm.2784