
Page 24 - ARNM-2-1
P. 24
Advances in Radiotherapy
& Nuclear Medicine Is 5-mm PTV margin 4D-CT-based radiotherapy
mandatory. The maximum intensity projection picture was (iii) IGTVN_4D versus GTVN_3D: only two datasets with
used to contour the GTV_4D for primary and/or nodal gross nodal disease contours.
illnesses. Phases spanning 0 – 90% of the respiratory cycle (iv) PTV_4D and PTV_3D. PTV for two sets of data:
were separately examined to ensure adequate contouring of PTVD 95_4D and PTVD 95_3D. In both plans,
IGTV_4D or composite GTV_4D. Subsequently, CTV_4D 95% of the recommended dosage for PTV_3D and
or internal target volume_4D (ITV_4D) was defined by PTV_4D was covered by the volume. The extrapolated
expanding IGTV_4D by 5 mm and modifying it to remove plan (of the FBCT-based target volume) for PTV_4D
natural barriers, such as bones and air. To account for was evaluated for this comparison.
setup errors only, PTV_4D was defined as CTV_4D plus a
0.5-cm isotropic expansion (Figure 1). (i) Histogram of dose-volume dosage that the OAR
(heart, lungs, spinal cord, and esophagus) received in
Intensity-modulated radiation therapy plans were both schemes.
created in accordance with departmental policy whereby (ii) Dice similarity coefficient (DIC): the dice similarity
95% PTV should cover at least 95% of the prescribed dose coefficient was computed to investigate the overlap
in the Eclipse (V15.6.03) planning system. 18,19 All plans between PTV_3D and PTV_4D. In DIC, the region
were optimized using the photon optimizer algorithm, and of overlap between two measures in a single patient is
the dose calculation was performed using the anisotropic denoted by “a,” the area identified in the first measure
analytic algorithm (AAA-dose calculation algorithm). but not in the second is denoted by “b,” and the area
The main aim was to minimize the OAR dose as much as identified in the second measure but not in the first is
possible without disturbing PTV coverage. Each plan was denoted by “c.” DIC was calculated using the following
evaluated using the dose-volume histogram generated by formula (Equation I),
12
the planning system. Each patient received two radiation
plans: one based on a volume estimated from FBCT data DIC=2a/(2a + b + c) (I)
and the other utilizing a volume estimated from FBCT Before initiating treatment, every patient underwent
data together with comparable geometry, gantry angles or daily scans with the scan length configured using scan
arcs, and additional optimization and planning factors. All parameters to cover the entire PTV length (ascertained
research participants underwent IMRT with plans created from the contours displayed in this window). With
using volumes based on 4D-CT. Next, the plans based on matching axes set to translations, the scan length was first
FBCT were replicated on the volume dataset for 4D-CT. A automatically matched using the “bone and soft tissue”
cone-beam CT scan (CBCT) image guidance was provided preset. Every automated match was examined manually,
daily to the study participants. with a particular focus on the region containing the gross
Next, the two plans were compared as follows: tumor volume or high-dose volumes. The changes in the
(i) IGTV_4D versus GTV_3D: two datasets with one mediolateral (x), craniocaudal (y), and anteroposterior
volume representing gross pulmonary and nodal tumors. (z) translational axes were tabulated, and the error vector
(ii) IGTVP_4D versus GTVP_3D: only two datasets (√x +√y +√z ) was generated using summary data from
2
2
2
showed gross pulmonary disease contours. pre-treatment kilo-voltage computed tomography (KVCT)
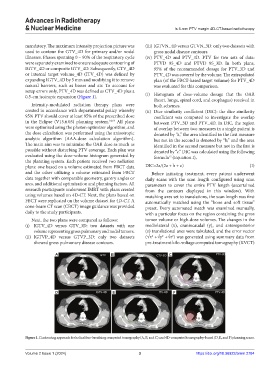
A B C
D E F
Figure 1. Contouring approach for helical free-breathing computed tomography (A, B, and C) and 4D-computed tomography-based (D, E, and F) planning scans.
Volume 2 Issue 1 (2024) 3 https://doi.org/10.36922/arnm.2784