
Page 20 - BH-1-2
P. 20
Brain & Heart Pemafibrate in patients with dyslipidemia
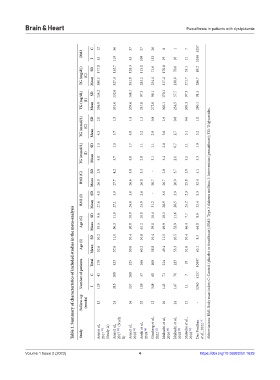
C 12 36 37 57 26 8 1 7 5257
DM2
I 43 119 43 109 133 19 10 11 5240
TG (mg/dL) (C) SD Mean 177.0 380.5 132.7 327.4 128.3 351.8 115.0 283.2 71.6 254.4 170.8 317.4 70.8 238.9 53.1 271.7 89.2 286.7
TG (mg/dL) (I) SD Mean 134.2 356.9 132.6 331.6 148.1 359.6 97.3 247.8 96.1 272.0 170.1 305.1 57.7 234.5 97.3 305.3 91.5 290.1
TG (mmol/L) (C) SD Mean 2.0 4.3 1.5 3.7 1.4 4.0 1.3 3.2 0.8 2.9 1.9 3.6 0.8 2.7 0.6 3.1 1.0 3.2
TG (mmol/L) (I) SD Mean 1.5 4.0 1.5 3.7 1.7 4.0 1.1 2.8 1.1 3.1 2.0 3.4 0.7 2.6 1.1 3.5 1.0 3.3
BMI (C) SD Mean 2.9 26.3 4.2 27.7 3.8 26.6 3.3 26.0 - 30.7 2.8 26.7 3.7 26.0 2.9 25.8 5.1 32.4
BMI (I) SD Mean 4.0 27.6 3.9 27.1 3.6 26.8 3.6 25.9 - 31.2 3.6 26.9 3.9 26.5 2.3 25.2 5.3 32.4
Table 1. Summary of characteristics of included studies in the meta-analysis
Age (C) SD Mean 9.6 55.5 11.9 56.3 10.0 50.0 10.0 61.2 10.4 59.0 10.3 49.9 11.6 52.9 7.7 46.4 8.9 64.0 Abbreviations: BMI: Body mass index; C: Control (placebo or fenofibrate); DM2: Type 2 diabetes mellitus; I: Intervention (pemafibrate); TG: Triglycerides.
SD 10.2 11.0 10.4 10.8 10.4 11.5 10.5 10.4 8.3
Age (I) Mean 52.6 57.6 50.6 60.2 58.8 49.4 53.3 51.6 63.1
Number of patients Total C I 170 41 129 423 108 315 525 268 257 166 57 109 408 60 348 214 71 143 223 76 147 18 7 11 10497 5257 5240
Follow-up (weeks) 12 24 16 52 12 16 24 12 -
Study Arai et al., 2017 [23] (Study A) Arai et al., 2017 [23] (Study B) Arai et al., 2018 [15] Araki et al., 2018 [24] Ginsberg et al., 2022 [25] Ishibashi et al., 2016 [26] Ishibashi et al., 2018 [16] Matsuba et al., 2018 [27] Das Pradhan et al., 2022 [18]
Volume 1 Issue 2 (2023) 4 https://doi.org/10.36922/bh.1629