
Page 24 - BH-1-2
P. 24
Brain & Heart Pemafibrate in patients with dyslipidemia
Figure 13. A greater reduction in total cholesterol levels following treatment with pemafibrate at 0.2 mg/day.
Figure 14. A greater reduction of triglyceride levels following treatment with pemafibrate at 0.2 mg/day.
Figure 15. No significant difference in triglyceride levels following treatment with pemafibrate at 0.2 mg/day compared to fenofibrate at 200 mg/day
Figure 16. Significantly higher high-density lipoprotein levels following treatment with pemafibrate at 0.1 mg/day.
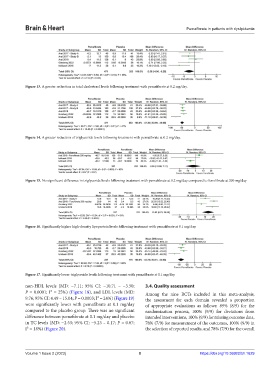
Figure 17. Significantly lower triglyceride levels following treatment with pemafibrate at 0.1 mg/day.
non-HDL levels (MD: −7.11; 95% CI: −10.71 – −3.50; 3.4. Quality assessment
P = 0.0001; I² = 25%) (Figure 18), and LDL levels (MD: Among the nine RCTs included in this meta-analysis,
9.76; 95% CI: 4.49 – 15.04; P = 0.0003; I² = 24%) (Figure 19) the assessment for each domain revealed a proportion
were significantly lower with pemafibrate at 0.1 mg/day of appropriate evaluations as follows: 89% (8/9) for the
compared to the placebo group. There was no significant randomization process, 100% (9/9) for deviations from
difference between pemafibrate at 0.1 mg/day and placebo intended interventions, 100% (9/9) for missing outcome data,
in TC levels (MD: −2.53; 95% CI: −5.23 – 0.17; P = 0.07; 78% (7/9) for measurement of the outcomes, 100% (9/9) in
I² = 18%) (Figure 20). the selection of reported results, and 78% (7/9) for the overall
Volume 1 Issue 2 (2023) 8 https://doi.org/10.36922/bh.1629