
Page 21 - BH-1-2
P. 21
Brain & Heart Pemafibrate in patients with dyslipidemia
3.2. Pooled analysis of all studies P < 0.00001; I² = 93%) (Figure 2). Within the group
The primary outcome of interest was the percent reduction receiving pemafibrate, there was an overall trend toward
in total TG, which exhibited a significant improvement an increased percent of HDL (MD: 13.84; 95% CI: 8.09
in the pemafibrate group when compared with placebo – 19.59; P < 0.00001; I² = 95%) (Figure 3). Conversely, in
across all doses (MD: −45.65; 95% CI: −57.31 – −33.98; the placebo group, a significant decrease in LDL levels was
observed (MD: 11.82; 95% CI: 8.61 – 15.04; P < 0.00001;
I² = 57%) (Figure 4). However, there was no significant
difference in the percent of TC between patients who
received the placebo compared with those treated with all
doses of pemafibrate (MD: −1.74; 95% CI: −3.98 – 0.49;
P < 0.13; I² = 73%) (Figure 5).
3.3. Subanalysis of selected populations
In a subanalysis of patients treated with 0.4 mg/day of
pemafibrate versus placebo, the pemafibrate group exhibited
a higher percent of the decrease in serum TG (MD: −48.29;
95% CI: −61.45 – −35.13; P < 0.0001; I² = 93%) (Figure 6).
Furthermore, individuals receiving a daily dosage of 0.4 mg
of pemafibrate experienced a significant reduction in non-
HDL levels compared to the placebo group (MD: −6.35;
95% CI: −10.62 – −2.08; P = 0.004; I² = 82%) (Figure 7).
Placebo recipients had significantly lower LDL levels than
those treated with pemafibrate 0.4 mg/day (MD: 12.86;
95% CI: 9.43 – 16.29; P < 0.00001; I² = 40%) (Figure 8).
The pemafibrate group at the 0.4 mg/day dose exhibited a
significant increase in HDL levels (MD: 13.66; 95% CI: 8.06
– 19.27; P < 0.00001; I² = 92%) (Figure 9). No significant
differences were observed for adverse events (MD: 0.97;
95% CI: 0.73 – 1.29; P = 0.84; I² = 0%) (Figure 10) and TC
levels (MD: −1.73; 95% CI: −4.14 – 0.68; P = 0.16; I² = 65%)
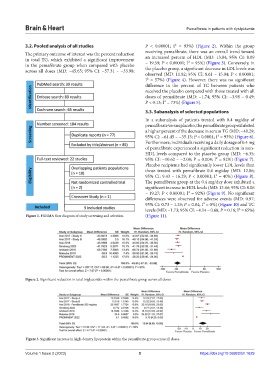
Figure 1. PRISMA flow diagram of study screening and selection. (Figure 11).
Figure 2. Significant reduction in total triglycerides within the pemafibrate group across all doses.
Figure 3. Significant increase in high-density lipoprotein within the pemafibrate group across all doses.
Volume 1 Issue 2 (2023) 5 https://doi.org/10.36922/bh.1629