
Page 69 - BH-2-2
P. 69
Brain & Heart The relationship between LE8 score and ASCVD
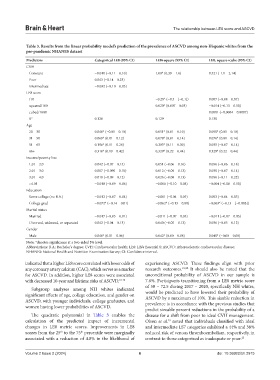
Table 3. Results from the linear probability model’s prediction of the prevalence of ASCVD among non‑Hispanic whites from the
pre‑pandemic NHANES dataset
Predictors Categorical LE8 (95% CI) LE8+square (95% CI) LE8, square+cube (95% CI)
CVH
Constant −0.010 (−0.11 – 0.10) 1.00* (0.39 – 1.6) 0.521 (-1.1 – 2.14)
Poor 0.043 (−0.14 – 0.23) - -
Intermediate −0.032 (−0.10 – 0.03) - -
LE8 score
/10 - −0.29* (−0.5 – [−0.1]) 0.007 (−0.08 – 0.07)
squared/100 - 0.020* (0.007 – 0.03) −0.014 (−0.13 – 0.10)
cubed/1000 - - 0.0001 (−0.0004 – 0.0007)
R 2 0.120 0.129 0.130
Age
20 – 30 0.040* (−0.01 – 0.10) 0.051* (0.01 – 0.10) 0.050* (0.01 – 0.10)
31 – 50 0.069* (0.01 – 0.12) 0.078* (0.01 – 0.14) 0.076* (0.01 – 0.14)
51 – 65 0.196* (0.11 – 0.28) 0.203* (0.11 – 0.30) 0.035 (−0.07 – 0.14)
66+ 0.310* (0.19 – 0.42) 0.329* (0.22 – 0.44) 0.329* (0.22 – 0.44)
Income/poverty line
1.01 – 2.0 0.042 (−0.07 – 0.15) 0.051 (−0.06 – 0.16) 0.056 (−0.06 – 0.18)
2.01 – 3.0 0.007 (−0.090 – 0.10) 0.012 (−0.09 – 0.13) 0.030 (−0.07 – 0.14)
3.01 – 4.0 0.018 (−0.09 – 0.12) 0.026 (−0.08 – 0.13) 0.056 (−0.11 – 0.22)
>4.01 −0.018 (−0.09 – 0.06) −0.006 (−0.10 – 0.08) −0.004 (−0.08 – 0.10)
Education
Some college (no B.A.) −0.012 (−0.07 – 0.04) −0.001 (−0.04 – 0.05) 0.003 (−0.04 – 0.05)
College grad −0.072* (−0.14 – 0.01) −0.062* (−0.13 – 0.00) −0.063* (−0.13 – [−0.003])
Marital status
Married −0.017 (−0.05 – 0.01) −0.011 (−0.07 – 0.05) −0.011 (−0.07 – 0.05)
Divorced, widowed, or separated 0.042 (−0.04 – 0.13) 0.040 (−0.05 – 0.13) 0.036 (−0.05 – 0.12)
Gender
Male 0.040* (0.01 – 0.06) 0.042* (0.00 – 0.08) 0.040* (−0.00 – 0.08)
Note: *denotes significance at a two-sided 5% level.
Abbreviations: B.A.: Bachelor’s degree; CVH: Cardiovascular health; LE8: Life’s Essential 8; ASCVD: Atherosclerotic cardiovascular disease;
NHANES: National Health and Nutrition Examination Survey; CI: Confidence interval.
indicated that a higher LE8 score correlated with lower odds of experiencing ASCVD. These findings align with prior
any coronary artery calcium (CAC), which serves as a marker research outcomes. 21,22 It should also be noted that the
for ASCVD. In addition, higher LE8 scores were associated unconditional probability of ASCVD in our sample is
with decreased 10-year and lifetime risks of ASCVD. 18-20 7.8%. Participants transitioning from a LE8 metric score
of 50 – 72.5 during 2017 – 2020, specifically NH whites,
Subgroup analyses among NH whites indicated
significant effects of age, college education, and gender on would be predicted to have lowered their probability of
ASCVD, with younger individuals, college graduates, and ASCVD by a maximum of 10%. This sizable reduction in
prevalence is in accordance with the previous studies that
women having lower probabilities of ASCVD.
predict sizeable percent reductions in the probability of a
The quadratic polynomial in Table 3 enables the disease for a shift from poor to ideal CVH management.
calculation of the predicted impact of incremental Olson et al. noted that individuals classified with ideal
23
changes in LE8 metric scores. Improvements in LE8 and intermediate LS7 categories exhibited a 44% and 38%
scores from the 25 to the 75 percentile were marginally reduced risk of venous thromboembolism, respectively, in
th
th
associated with a reduction of 4.8% in the likelihood of contrast to those categorized as inadequate or poor. 23
Volume 2 Issue 2 (2024) 6 doi: 10.36922/bh.2915