
Page 67 - BH-2-2
P. 67
Brain & Heart The relationship between LE8 score and ASCVD
comprising 50.38% of the population. Table 1 provides a with a higher proportion of them being in the ASCVD
comprehensive breakdown of demographic characteristics subgroup. There are statistical differences between the
for the study population. two marital status subgroups, with the ASCVD subgroup
The ASCVD subgroup had a mean age of 69.4 years being both older and more likely to be married or formerly
(95% CI: 68.4 – 70.4), while the non-ASCVD subgroups married than the non-ASCVD subgroup.
had a mean age of 34.6 years (95% CI: 33.9 – 35.4), Only 11.33% of participants in the current sample
with 50.38% being female. These numbers were slightly met the ideal diet criteria (Table 2). The frequency of
higher than the average ages for the combined race participants meeting the ideal level for the remaining
sample, which were 66.1 (95% CI: 65.4 – 66.8) and CVH metrics in the present sample was as follows: HbA1c
32.3 (95% CI: 31.9 – 32.7), respectively. (weighted, 94.6%), physical activity (weighted, 91.80%),
In Table 1, it is evident that males constituted a larger cigarette smoking (weighted, 70.79%), total cholesterol level
proportion of the ASCVD subgroup relative to the (weighted, 42.42%), BMI (weighted, 41.6%), blood pressure
non-ASCVD subgroup. Those achieving some college (weighted, 38.5%), and sleep health (weighted, 30.25%).
education but without a 4-year degree completion were While fewer than 5% of the entire sample displayed
overrepresented in the ASCVD subgroup relative to those subpar metric scores in the specific components related to
in the non-ASCVD subgroup (35.5% [95% CI: 31.6 – 39. vs. sleep health, glycated hemoglobin A1c, and physical activity,
5
21.3% [95% CI: 20.1 – 22. ; p<0.001). A similar statistically approximately 60% of the population is classified as obese
5
significant difference in the proportions of college graduates (BMI > 25 kg/m ). In addition, 34% adhered to a poor diet,
2
did not exist between the two ASCVD subgroups. However, and 32% had a total cholesterol level exceeding 222 mg/dL.
there is consistently a statistically significant difference The assessment revealed that 13.64% of individuals currently
between the proportions of individuals in different age engage in some form of smoking (Table 2).
groups between the two ASCVD subgroups. There is no
consistent difference between the five income groups. The The first regression (Table 3) compared poor and
second lowest income group has a statistical difference, moderate LE8 levels versus an ideal LE8 level of 80 or
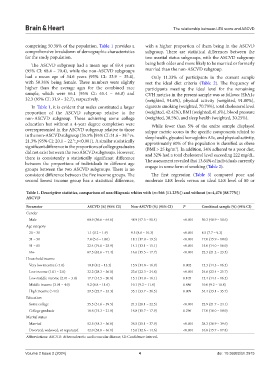
Table 1. Descriptive statistics, comparison of non‑Hispanic whites with (n=566 [11.23%]) and without (n=4,476 [88.77%])
ASCVD
Parameter ASCVD (%) (95% CI) Non‑ASCVD (%) (95% CI) P Combined sample (%) (95% CI)
Gender
Male 60.9 (56.6 – 64.6) 48.9 (47.5 – 50.4) <0.001 50.3 (48.9 – 50.6)
Age category
20 – 30 1.1 (0.2 – 1.9) 9.5 (8.6 – 10.3) <0.001 8.5 (7.7 – 9.3)
31 – 50 7.8 (5.6 – 10.0) 18.1 (17.0 – 19.3) <0.001 17.0 (15.9 – 18.0)
51 – 65 22.4 (19.0 – 25.9) 14.1 (13.1 – 15.1) <0.001 15.0 (14.0 – 16.0)
66+ 67.5 (63.6 – 71.4) 16.6 (15.5 – 17.7) <0.001 22.3 (21.2 – 23.5)
Household income
Very low income (<1.0) 10.8 (8.2 – 13.3) 15.9 (14.8 – 16.9) 0.002 15.3 (14.3 – 16.3)
Low income (1.01 – 2.0) 32.2 (28.3 – 36.0) 23.6 (22.3 – 24.8) <0.001 24.6 (23.4 – 25.7)
Low middle income (2.01 – 3.0) 17.7 (14.5 – 20.8) 15.1 (14.0 – 16.1) 0.105 15.4 (14.4 – 16.3)
Middle income (3.01 – 4.0) 9.2 (6.8 – 11.6) 10.1 (9.2 – 11.0) 0.486 10.0 (9.2 – 10.8)
High income (>4.0) 29.5 (25.7 – 33.3) 35.1 (33.7 – 36.5) 0.009 34.4 (33.1 – 35.7)
Education
Some college 35.5 (31.6 – 39.5) 21.3 (20.1 – 22.5) <0.001 22.9 (21.7 – 24.1)
College graduate 18.6 (15.3 – 21.8) 16.8 (15.7 – 17.9) 0.296 17.0 (16.0 – 18.0)
Marital status
Married 52.5 (48.3 – 56.6) 36.5 (35.1 – 37.9) <0.001 38.3 (36.9 – 39.6)
Divorced, widowed, or separated 42.0 (38.0 – 46.1) 13.6 (12.6 – 14.6) <0.001 16.8 (15.7 – 17.8)
Abbreviations: ASCVD: Atherosclerotic cardiovascular disease; CI: Confidence interval.
Volume 2 Issue 2 (2024) 4 doi: 10.36922/bh.2915