
Page 102 - BH-2-4
P. 102
Brain & Heart RSA and breathing-specific heart rate
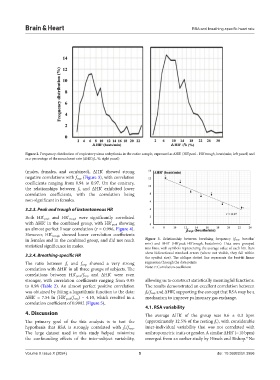
Figure 2. Frequency distribution of respiratory sinus arrhythmia in the entire sample, expressed as ΔHR’ (HR’peak - HR’trough, beats/min; left panel) and
as a percentage of the mean heart rate (ΔHR’/fh, %; right panel)
(males, females, and combined), ΔHR’ showed strong
negative correlations with f resp (Figure 3), with correlation
coefficients ranging from 0.94 to 0.97. On the contrary,
the relationships between f h and ΔHR’ exhibited lower
correlation coefficients, with the correlation being
non-significant in females.
3.2.3. Peak and trough of instantaneous HR
Both HR’ peak and HR’ trough were significantly correlated
with ΔHR’ in the combined group, with HR’ peak showing
an almost perfect linear correlation (r = 0.996, Figure 4).
However, HR’ trough showed lower correlation coefficients
in females and in the combined group, and did not reach Figure 3. Relationship between breathing frequency (fresp, breaths/
statistical significance in males. min) and ΔHR’ (HR’peak-HR’trough, beats/min). Data were grouped
into bins, with symbols representing the average value of each bin. Bars
3.2.4. Breathing-specific HR show bidirectional standard errors (where not visible, they fall within
the symbol size). The oblique dotted line represents the best-fit linear
The ratio between f h and f resp showed a very strong regression through the data points
correlation with ΔHR’ in all three groups of subjects. The Note: r: Correlation coefficient
correlations between HR’ peak/f resp and ΔHR’ were even
stronger, with correlation coefficients ranging from 0.95 allowing us to construct statistically meaningful functions.
to 0.98 (Table 2). An almost perfect positive correlation The results demonstrated an excellent correlation between
was obtained by fitting a logarithmic function to the data: f h/f resp and ΔHR’, supporting the concept that RSA may be a
ΔHR’ = 7.54 ln (HR’ peak/f resp) – 4.10, which resulted in a mechanism to improve pulmonary gas exchange.
correlation coefficient of 0.9992 (Figure 5).
4.1. RSA variability
4. Discussion The average ΔHR’ of the group was 8.6 ± 0.3 bpm
The primary goal of the this analysis is to test the (approximately 12.5% of the resting f h), with considerable
hypothesis that RSA is strongly correlated with f h/f resp. inter-individual variability that was not correlated with
The large dataset used in this study helped minimize anthropometric traits or gender. A similar ΔHR’ (~10 bpm)
the confounding effects of the inter-subject variability, emerged from an earlier study by Hirsch and Bishop. No
4
Volume X Issue X (2024) 5 doi: 10.36922/bh.3956