
Page 100 - BH-2-4
P. 100
Brain & Heart RSA and breathing-specific heart rate
“Experimental Physiology” (McGill University, Montreal, The rc and abd signals were digitally acquired at 100 Hz,
Canada, course # Physiology Lab 213). Each participant while the ECG was acquired at 400 Hz. These signals,
was instructed on the maneuver to be performed, but along with the electronically computed beat-to-beat HR’,
the specific purpose of the study was not disclosed. All were displayed on a computer monitor and saved for later
measurements were non-invasive. The study adhered to analysis (Figure 1).
the ethical standards set by the Declaration of Helsinki,
and the procedures were approved by the ethics committee 2.3. Data analysis
of the university. During the resting condition, once the breathing pattern
was stable and reproducible, a 5-min recording period
2.2. Instrumentation was initiated. At the end of this period, 10 consecutive
Measurements were taken in the early afternoon. The breathing cycles were analyzed. The mean f h (beats/min)
subjects were positioned supine on a comfortable mattress, and mean f resp (breaths/min) were calculated for the
with no visual access to the computer monitor. To minimize analysis period. The highest (HR’ peak) and lowest (HR’ trough)
external disturbances, participants wore an ear set and values of HR’ within each breath were identified, and their
were allowed to close their eyes while remaining awake. difference (ΔHR’ = HR’ peak – HR’ trough) was used to represent
Electrocardiogram (ECG) and breathing movements the magnitude of RSA, expressed in beats/min. Detailed
were measured. ECG was recorded from standard descriptions of the instrumentation and data analysis can
23,38,39,41
peripheral lead placements. An ad hoc algorithm detected be obtained from earlier studies.
the peak of the R-waves of the ECG to compute IBI (ms). When a subject had more than one recording period,
IBI was converted into instantaneous HR (HR’, beats/min) the values from each epoch were averaged. Data from
using the formula HR’ = 60/(IBI/1000), which represents all subjects, either separated by gender or combined,
the number of heartbeats per minute, assuming successive were pooled together to obtain the group grand mean.
R-R intervals remain constant. Breathing movements were To construct the correlations between parameter X and
recorded using impedance pneumography, with two Piezo RSA, the following procedure was used: First, X-values
Respiratory Belt Transducers (ADInstruments, United were divided into seven approximately equidistant bins.
States) positioned around the rib cage (rc, approximately This binning process minimized the potential skewing
at the level of the fifth intercostal space) and around the effect of uneven distributions. The average value for each
abdomen (abd, at the level of the umbilicus). The sum bin was calculated, and the resulting seven data points
of the rc and abd measurements in supine males reliably were fitted using linear regression (Y = a + b⋅X), where
reflects changes in lung volume. 42-44 X is the parameter of interest, and Y is ΔHR’. Group
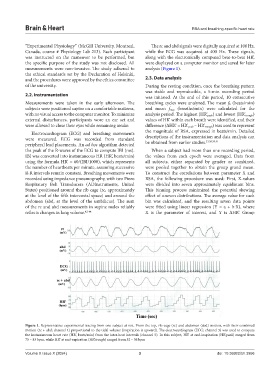
Figure 1. Representative experimental tracing from one subject at rest. From the top, rib cage (rc) and abdomen (abd) motion, with their combined
motion (rc + abd; channel 4) proportional to the tidal volume (inspiration is upward). The electrocardiogram (ECG; channel 3) was used to compute
the instantaneous heart rate (HR’, beats/min) from the inter-beat intervals (channel 5). In this subject, HR’ at end-inspiration (HR’peak) ranged from
75 – 83 bpm, while HR’ at end-expiration (HR’trough) ranged from 52 – 56 bpm
Volume X Issue X (2024) 3 doi: 10.36922/bh.3956