
Page 103 - BH-2-4
P. 103
Brain & Heart RSA and breathing-specific heart rate
that for mean f h, HR’ peak or HR’ trough because the average
values (the denominator in the CV computation) were
four times smaller (Table 1).
The variability in ΔHR’ could have been lower if the
inter-individual differences in HR’ peak and HR’ trough were
of similar magnitude, but this was not the case. In fact,
the correlation between ΔHR’ and HR’ peak (i.e., when
parasympathetic control is absent) was stronger than that
with HR’ trough (Figure 4), where no significant correlation
was found in males. Since cardiac vagal output is inhibited
at end-inspiration, it seems reasonable to conclude that
the inter-subject variability in RSA is largely driven by
the inter-subject variability in the sympathetic regulation
of f h. The stronger correlation between ΔHR’ with HR’ peak
compared to HR’ trough suggests that sympathetic output
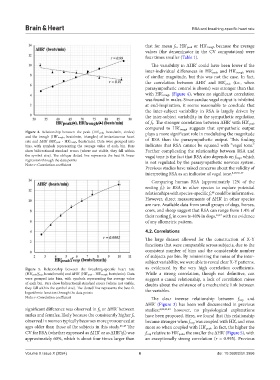
Figure 4. Relationship between the peak (HR’peak, beats/min, circles) plays a more significant role in modulating the magnitude
and the trough (HR’trough, beats/min, triangles) of instantaneous heart
rate and ΔHR’ (HR’peak - HR’trough, beats/min). Data were grouped into of RSA than the parasympathetic output. This finding
bins, with symbols representing the average value of each bin. Bars indicates that RSA cannot be equated with “vagal tone.”
show bidirectional standard errors (where not visible, they fall within Further complicating the relationship between RSA and
the symbol size). The oblique dotted line represents the best-fit linear vagal tone is the fact that RSA also depends on f resp, which
regression through the data points is not regulated by the parasympathetic nervous system.
Note: r: Correlation coefficient
Previous studies have raised concerns about the validity of
interpreting RSA as an indicator of vagal tone. 8,19,35-37
Comparing human RSA (approximately 12% of the
resting f h) to RSA in other species to explore potential
relationships with species-specific f h could be informative.
48
However, direct measurements of ΔHR’ in other species
are rare. Available data from small groups of dogs, horses,
cows, and sheep suggest that RSA can range from 1.4% of
their resting f h in cows to 40% in dogs, 16,17 with no evidence
of any allometric pattern.
4.2. Correlations
The large dataset allowed for the construction of X-Y
functions that were comparable across subjects, due to the
consistent number of bins and the considerable number
of subjects per bin. By minimizing the noise of the inter-
subject variability, we were able to reveal clear X-Y patterns,
Figure 5. Relationship between the breathing-specific heart rate as evidenced by the very high correlation coefficients.
(HR’peak/fresp, beats/breath) and ΔHR’ (HR’peak - HR’trough, beats/min). Data While a strong correlation, though not definitive, can
were grouped into bins, with symbols representing the average value suggest a causal relationship, a lack of correlation raises
of each bin. Bars show bidirectional standard errors (where not visible, doubts about the existence of a mechanistic link between
they fall within the symbol size). The dotted line represents the best-fit the variables.
logarithmic function through the data points
Note: r: Correlation coefficient The clear inverse relationship between f resp and
ΔHR’ (Figure 3) has been well documented in previous
significant difference was observed in f h or ΔHR’ between studies; 4,22,23,49 however, no physiological explanations
males and females, likely because the consistently higher f h have been proposed. Here, we found that this relationship
observed in women typically becomes more pronounced at became stronger when f resp was coupled with HR’, and even
ages older than those of the subjects in this study. 45-47 The more so when coupled with HR’ peak. In fact, the higher the
CV for RSA (whether expressed as ΔHR’ or as ΔHR’/f h) was f resp relative to HR’ peak, the smaller the ΔHR’ (Figure 5), with
approximately 60%, which is about four times larger than an exceptionally strong correlation (r = 0.995). Previous
Volume X Issue X (2024) 6 doi: 10.36922/bh.3956