
Page 64 - BH-2-4
P. 64
Brain & Heart Alzheimer’s disease: Gene and protein network analysis
2.6. MicroRNA-hub gene regulatory network analysis identifying 732 DEGs, including 465 upregulated genes
The microRNA (miRNA)-hub gene regulatory network and 267 downregulated genes (Supplementary Files).
was constructed using the miRNet database (https://www. This important finding unraveled the extensive genetic
mirnet.ca/), 27,28 a comprehensive database containing both alterations associated with AD, providing crucial insights
predicted and experimentally confirmed miRNA-target for further investigation. The identified DEGs could
potentially serve as biomarkers for early diagnosis or
interactions with a range of innovative features. Briefly, targets for therapeutic interventions in AD.
hub genes were identified from the DEGs using the miRNet
database, followed by the visualization and refinement of 3.2. Functional enrichment analysis
the miRNA-hub gene regulatory network with Cytoscape
software (version 3.8.2). A comprehensive GO enrichment analysis was performed
to delineate the functional involvement of the retrieved
2.7. Hub gene validation through receiver-operating genes in AD-related pathways, which was critical in
characteristic curve analysis uncovering the biological implications of the identified
DEGs.
Receiver-operating characteristic (ROC) curve analyses
were performed using the R package pROC to evaluate the GO enrichment analysis results exhibited significant
diagnostic potential of the hub genes for AD. This analysis pathways and functions in AD (Figure 2). Specifically, the
28
enabled the examination of the sensitivity and specificity cytosolic ribosome (GO:0022626) was identified as a key
of the hub genes as biomarkers for AD. The prediction component since 26 of 498 genes of interest were enriched
accuracy was quantified by calculating the area under the in this pathway, suggesting the substantial involvement of
ROC curve (AUC), which is an indicator for comparing these genes in ribosomal function, which is vital for protein
the diagnostic efficacy of the identified genes. synthesis and cellular homeostasis. Moreover, 29 out of
485 genes were enriched in the cytoplasmic translation
3. Results (GO:0002181) pathway, underscoring potential alterations
in protein translation processes in AD. In addition, 28 and
3.1. DEG identification
29 genes were respectively enriched in ribosomal subunit
Initially, differential gene expression was conducted by (GO:0044391) and ribosome (GO:0005840), indicating
comparing AD samples with control samples within possible disruptions or modifications in ribosomal
GSE4757. 29,30 A substantial number of DEGs were screened structure and function in AD. Moreover, 26 out of 507 genes
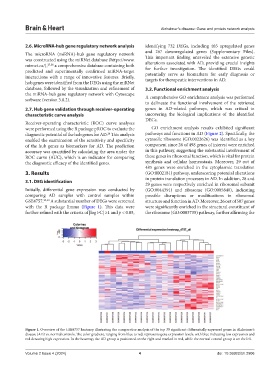
with the R package limma (Figure 1). This data were were significantly enriched in the structural constituent of
further refined with the criteria of |log FC| ≥1 and p < 0.05, the ribosome (GO:0003735) pathway, further affirming the
Figure 1. Overview of the GSE4757 heatmap illustrating the comparative analysis of the top 30 significant differentially expressed genes in Alzheimer’s
disease (AD) vs. normal controls. The color gradient, ranging from blue to red, represents gene expression levels, with blue indicating low expression and
red denoting high expression. In the heatmap, the AD group is positioned on the right and marked in red, while the normal control group is on the left.
Volume 2 Issue 4 (2024) 4 doi: 10.36922/bh.2906