
Page 67 - BH-2-4
P. 67
Brain & Heart Alzheimer’s disease: Gene and protein network analysis
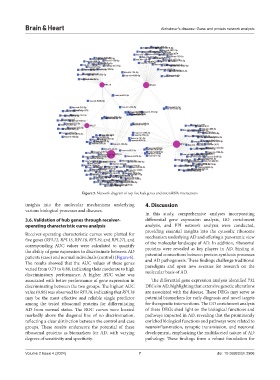
Figure 5. Network diagram of top five hub genes and microRNA interactions
insights into the molecular mechanisms underlying 4. Discussion
various biological processes and diseases.
In this study, comprehensive analyses incorporating
3.6. Validation of hub genes through receiver- differential gene expression analysis, GO enrichment
operating characteristic curve analysis analysis, and PPI network analysis were conducted,
providing essential insights into the cytosolic ribosome
Receiver-operating characteristic curves were plotted for mechanism underlying AD and offering a panoramic view
five genes (RPL12, RPL15, RPL18, RPL19, and RPL27), and of the molecular landscape of AD. In addition, ribosomal
corresponding AUC values were calculated to quantify
the ability of gene expression to discriminate between AD proteins were revealed as key players in AD, hinting at
potential connections between protein synthesis processes
patients (case) and normal individuals (control) (Figure 6).
The results showed that the AUC values of these genes and AD pathogenesis. These findings challenge traditional
varied from 0.73 to 0.86, indicating their moderate to high paradigms and open new avenues for research on the
molecular basis of AD.
discriminatory performance. A higher AUC value was
associated with better performance of gene expression in The differential gene expression analysis identified 732
discriminating between the two groups. The highest AUC DEGs in AD, highlighting that extensive genetic alterations
value (0.86) was observed for RPL18, indicating that RPL18 are associated with the disease. These DEGs may serve as
may be the most effective and reliable single predictor potential biomarkers for early diagnosis and novel targets
among the tested ribosomal proteins for differentiating for therapeutic interventions. The GO enrichment analysis
AD from normal status. The ROC curves were located of these DEGs shed light on the biological functions and
markedly above the diagonal line of no discrimination, pathways impacted in AD, revealing that the prominently
reflecting a clear distinction between the control and case enriched biological functions and pathways were related to
groups. These results underscore the potential of these neuroinflammation, synaptic transmission, and neuronal
ribosomal proteins as biomarkers for AD, with varying development, emphasizing the multifaceted nature of AD
degrees of sensitivity and specificity. pathology. These findings form a robust foundation for
Volume 2 Issue 4 (2024) 7 doi: 10.36922/bh.2906