
Page 74 - BH-3-1
P. 74
Brain & Heart Stroke risk in Nigerians with diabetes and hypertension
3.4. HTN and diabetes cohort
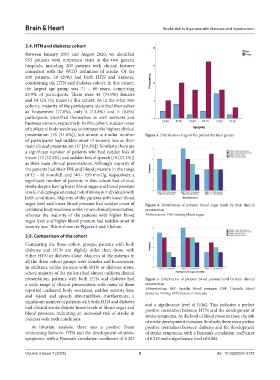
Between January 2015 and August 2020, we identified
933 patients with outpatient visits at the two general
hospitals, including 200 patients with clinical features
consistent with the WHO definition of stroke. Of the
200 patients, 58 (29%) had both HTN and diabetes,
constituting the HTN and diabetes cohort. In this cohort,
the largest age group was 71 – 80 years, comprising
25.9% of participants. There were 44 (75.9%) females
and 14 (24.1%) males in this cohort. As in the other two
cohorts, majority of the participants identified themselves
as housewives (77.6%), only 8 (13.8%) and 5 (8.6%)
participants identified themselves as civil servants and
business owners, respectively. In this cohort, sudden onset
of unilateral body weakness constitutes the highest clinical
presentation (18 [31.0%]), but almost a similar number Figure 3. Distribution of age of the patients by their gender
of participants had sudden onset of sensory loss as their
main clinical presentation (17 [29.3%]). Similarly, there are
a significant number of patients who had sudden loss of
vision (13 [22.4%]) and sudden loss of speech (10 [17.2%])
as their main clinical presentations. Although majority of
the patients had their FBS and blood pressure in the range
of 12 – 18 mmol/dL and 140 – 159 mmHg, respectively, a
significant number of patients in this cohort had clinical
stroke despite having lower blood sugar and blood pressure
levels, indicating an elevated risk of stroke in individuals with
both conditions. Majority of the patients with lower blood
sugar level and lower blood pressure had sudden onset of Figure 4. Distribution of patients’ blood sugar levels by their clinical
unilateral body weakness as their main clinical presentation, presentation
whereas the majority of the patients with higher blood Abbreviation: FBS: Fasting blood sugar.
sugar level and higher blood pressure had sudden onset of
sensory loss. This is shown in Figures 4 and 5 below.
3.5. Comparison of the cohort
Comparing the three cohort groups, patients with both
diabetes and HTN are slightly older than those with
either HTN or diabetes alone. Majority of the patients in
all the three cohort groups were females and housewives.
In addition, unlike patients with HTN or diabetes alone,
where majority of the patients had almost uniform clinical
presentation, patients with both HTN and diabetes had Figure 5. Distribution of patients’ blood pressure level by their clinical
a wide range of clinical presentation with many of them presentation
reported unilateral body weakness, sudden sensory loss, Abbreviations: SBP: Systolic blood pressure; DBP: Diastolic blood
and visual and speech abnormalities. Furthermore, a pressure; mmHg: Millimeters of mercury.
significant number of patients with both HTN and diabetes
had clinical stroke despite lower levels of blood sugar and and a significance level of 0.082. This indicates a perfect
positive correlation between HTN and the development of
blood pressure, indicating an increased risk of stroke in stroke symptoms. As the level of blood pressure rises, the risk
patients with both conditions.
of stroke development increases. Similarly, there was a perfect
At bivariate analysis, there was a positive linear positive correlation between diabetes and the development
relationship between HTN and the development of stroke of stroke symptoms, with a Pearson’s correlation coefficient
symptoms, with a Pearson’s correlation coefficient of 0.202 of 0.213 and a significance level of 0.084.
Volume 3 Issue 1 (2025) 5 doi: 10.36922/bh.5722