
Page 75 - BH-3-1
P. 75
Brain & Heart Stroke risk in Nigerians with diabetes and hypertension
3.6. Stroke risk determinants within the cohort baseline glycemic control was not independently associated
Unadjusted analysis revealed five risk factors for with an increased risk of stroke occurrence.
stroke, including female gender, advancing age, being While diabetes mellitus is a well-established risk factor
unemployed, HTN, and diabetes. We defined housewife as for stroke, the extent of this risk varies considerably across
15
unemployment in this context. Using multiple correlation different studies. Multiple large-scale population studies
regression analysis, the overall correlation between age, have demonstrated an elevated prevalence of stroke
gender, occupation, HTN, and diabetes with the risk of in individuals with diagnosed diabetes, undiagnosed
16
developing stroke symptoms was statistically significant (R diabetes, and those exhibiting glucose intolerance.
value: 0.288; R Square: 0.083; F value: 0.943; Sig: 0.461). Numerous epidemiological studies have demonstrated an
All five factors were also independently associated with the independent association between diabetes and the risk of
risk of occurrence of stroke symptoms. However, HTN had ischemic stroke in both sexes, with relative risks for diabetics
17
the strongest association with risk of stroke development, ranging from 1.8 to approximately 6. The elevated stroke
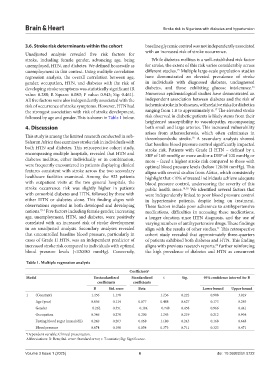
followed by age and gender. This is shown in Table 1 below. risk observed in diabetic patients is likely stems from their
heightened susceptibility to vasculopathy, encompassing
4. Discussion both small and large arteries. This increased vulnerability
arises from atherosclerosis, which often culminates in
This study is among the limited research conducted in sub- thromboembolic stroke. A secondary analysis showed
18
Saharan Africa that examines stroke risk in individuals with that baseline blood pressure control significantly impacted
both HTN and diabetes. This retrospective cohort study, stroke risk. Patients with Grade II HTN – defined by a
encompassing multiple hospitals, revealed that HTN and SBP of 160 mmHg or more and/or a DBP of 100 mmHg or
diabetes mellitus, either individually or in combination, more – faced a higher stroke risk compared to those with
were frequently encountered in patients displaying clinical optimal blood pressure levels (below 120/80 mmHg). This
features consistent with stroke across the two secondary aligns with several studies from Africa, which consistently
healthcare facilities examined. Among the 933 patients highlight that <10% of treated individuals achieve adequate
with outpatient visits at the two general hospitals, the blood pressure control, underscoring the severity of this
stroke occurrence risk was slightly higher in patients public health issue. 19,20 We identified several factors that
with comorbid diabetes and HTN, followed by those with were independently linked to poor blood pressure control
either HTN or diabetes alone. This finding aligns with in hypertensive patients, despite being on treatment.
observations reported in both developed and developing These factors include poor adherence to antihypertensive
nations. Five factors including female gender, increasing medications, difficulties in accessing these medications,
7,14
age, unemployment, HTN, and diabetes, were positively a longer duration since HTN diagnosis, and the use of
correlated with an increased risk of stroke development varying numbers of antihypertensive drugs. These findings
in an unadjusted analysis. Secondary analyses revealed align with the results of other studies. This retrospective
21
that uncontrolled baseline blood pressure, particularly in cohort study revealed that approximately three-quarters
cases of Grade II HTN, was an independent predictor of of patients exhibited both diabetes and HTN. This finding
increased stroke risk compared to individuals with optimal aligns with previous research reports, further reinforcing
22
blood pressure levels (<120/80 mmHg). Conversely, the high prevalence of diabetes and HTN as concurrent
Table 1. Multiple regression analysis
Coefficients a
Model Unstandardized Standardized t Sig. 95% confidence interval for B
coefficients coefficients
B Std. error Beta Lower bound Upper bound
1 (Constant) 1.456 1.178 1.236 0.222 −0.908 3.819
Age (year) 0.056 0.114 0.077 0.488 0.627 −0.173 0.285
Gender −0.262 0.351 −0.104 −0.748 0.458 −0.966 0.441
Occupation 0.346 0.278 0.200 1.245 0.219 −0.212 0.904
Fasting blood sugar (mmol/dL) 0.240 0.203 0.168 1.180 0.243 −0.168 0.648
Blood pressure 0.074 0.198 0.054 0.373 0.711 −0.323 0.471
a Dependent variable: Clinical presentation.
Abbreviations: B: Beta; Std. error: Standard error; t: T-statistic; Sig: Significance.
Volume 3 Issue 1 (2025) 6 doi: 10.36922/bh.5722