
Page 110 - EER-1-1
P. 110
Explora: Environment
and Resource Stratification and mixed layer deepening
Hence, the sequence (θ ) is strictly increasing.
t
n
Similarly, from line 4 of Table S2, we have:
t
t t = t +T /C’ (XII)
n+1 n n dyn
where T represents the necessarily positive energy
n
balance entering the atmosphere and leaving it through the
UOS or the top of the troposphere. Consequently:
t t n+1 >t t n (XIII)
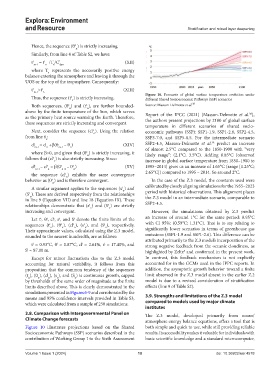
Thus, the sequence (t ) is strictly increasing. Figure 10. Forecasts of global surface temperature evolution under
t
n different Shared Socioeconomic Pathways (SSP) scenarios
Both sequences, (θ ) and (t ), are further bounded- Source: Masson-Delmotte et al. 38
t
t
n
n
above by the finite temperature of the Sun, which serves 38
as the primary heat source warming the Earth. Therefore, Report of the IPCC (2021) (Masson-Delmotte et al. ),
these sequences are strictly increasing and convergent. the authors present projections by 2100 of global surface
temperature in different scenarios of shared socio-
Next, consider the sequence (cl ). Using the relation economic pathways (SSP): SSP1-1.9, SSP1-2.6, SSP2-4.5,
t
n
from line 6 : SSP3-7.0, and SSP5-8.5. For the intermediate scenario
a
38
cl = cl +β(θ – θ ) (XIV) SSP2-4.5, Masson-Delmotte et al. predict an increase
n+1 n n+1 n of almost 2.5°C compared to the 1850-1900 with “very
where β>0, and given that (θ ) is strictly increasing, it likely range”: (2.1°C; 3.5°C). Adding 0.85°C (observed
t
n
follows that (cl ) is also strictly increasing. Since:
t
n increase in global surface temperature from 1850–1900 to
cl t – cl = β(θ t – θ ) (XV) 1995–2014) gives us an increase of 1.65°C (range [1.25°C;
t
t
n+1 n n+1 n
the sequence (cl ) exhibits the same convergence 2.65°C]) compared to 1995 – 2014. So around 2°C.
t
n
behavior as (θ ) and is therefore convergent. In the case of the Z.3 model, the constants used were
t
n
A similar argument applies to the sequences (s ) and calibrated by closely aligning simulations for the 1955–2023
t
n
(S ). These are derived respectively from the relationships period with historical observations. This alignment places
t
n
in line 9 (Equation VII) and line 18 (Equation IX). These the Z.3 model in an intermediate scenario, comparable to
relationships demonstrate that (s ) and (S ) are strictly SSP2-4.5.
t
t
n
n
increasing and convergent. However, the simulations obtained by Z.3 predict
Let t , θ , cl , s , and S denote the finite limits of the an increase of around 1°C for the same period: 0.95°C
t
t
t
t
t
t
t
t
t
sequences (t ), (θ ), (cl ), (s ), and (S ), respectively. with CI 95%: (0.59°C; 1.31°C). That is to say relating to
t
n
n
n
n
n
Their approximate values, calculated using the Z.3 model, significantly lower scenarios in terms of greenhouse gas
rounded to the nearest hundredth, are as follows: emissions (SSP1-1.9 and SSP1-2.6). This difference can be
attributed primarily to the Z.3 model’s incorporation of the
t ≈ 0.93°C, θ ≈ 0.87°C, cl ≈ 2.61%, s ≈ 17.40%, and strong negative feedback from the oceanic cloudiness, as
t
t
t
t
S ≈ 87.00 m. highlighted by Zeltz and confirmed in the present work.
t
8
Except for minor fluctuations due to the Z.3 model In contrast, this feedback mechanism is not explicitly
accounting for natural variability, it follows from this accounted for in the GCMs used in the IPPC reports. In
proposition that the common tendency of the sequences addition, the asymptotic growth behavior toward a finite
(t ), (θ ), (cl ), (s ), and (S ) is continuous growth, capped limit observed in the Z.3 model absent in the earlier Z.2
n
n
n
n
n
by thresholds of the same order of magnitude as the finite model is due to a revised consideration of stratification
limits described above. This is clearly demonstrated in the effects (line 9 of Table S2).
simulations presented in Figures 6-9 and corroborated by the
means and 95% confidence intervals provided in Table S3, 3.9. Strengths and limitations of the Z.3 model
which were calculated from a sample of 250 simulations. compared to models used by major climate
institutes
3.8. Comparison with Intergovernmental Panel on The Z.3 model, developed primarily from ocean/
Climate Change forecasts atmosphere energy balance equations, offers a tool that is
Figure 10 illustrates projections based on the Shared both simple and quick to use, while still providing reliable
Socioeconomic Pathways (SSP) scenarios described in the results. Its accessibility makes it valuable for individuals with
contribution of Working Group I to the Sixth Assessment basic scientific knowledge and a standard microcomputer,
Volume 1 Issue 1 (2024) 10 doi: 10.36922/eer.4578