
Page 109 - EER-1-1
P. 109
Explora: Environment
and Resource Stratification and mixed layer deepening
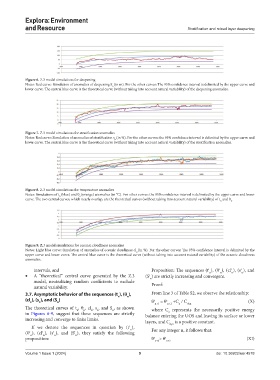
Figure 6. Z.3 model simulations for deepening
Notes: Red curve: Simulation of anomalies of deepening S (in m). For the other curves: The 95% confidence interval is delimited by the upper curve and
n
lower curve. The central blue curve is the theoretical curve (without taking into account natural variability) of the deepening anomalies.
Figure 7. Z.3 model simulations for stratification anomalies
Notes: Red curve: Simulation of anomalies of stratification s (in %). For the other curves: the 95% confidence interval is delimited by the upper curve and
n
lower curve. The central blue curve is the theoretical curve (without taking into account natural variability) of the stratification anomalies.
Figure 8. Z.3 model simulations for temperature anomalies
Notes: Simulations of t (blue) and θ (orange) anomalies (in °C). For other curves: the 95% confidence interval is delimited by the upper curve and lower
n
n
curve. The two central curves, which nearly overlap, are the theoretical curves (without taking into account natural variability) of t and θ . n
n
Figure 9: Z.3 model simulations for oceanic cloudiness anomalies
Notes: Light blue curve: Simulation of anomalies of oceanic cloudiness cl (in %). For the other curves: The 95% confidence interval is delimited by the
n
upper curve and lower curve. The central blue curve is the theoretical curve (without taking into account natural variability) of the oceanic cloudiness
anomalies.
t
intervals, and Proposition: The sequences (t ), (θ ), (cl ), (s ), and
t
t
t
n
n
• A “theoretical” central curve generated by the Z.3 (S ) are strictly increasing and convergent. n n
t
model, neutralizing random coefficients to exclude n Proof:
natural variability.
3.7. Asymptotic behavior of the sequences (t ), (θ ), From line 3 of Table S2, we observe the relationship:
n
n
(cl ), (s ), and (S ) θ t n+3 = θ t n+2 +C / C dyn (X)
n
n
n
n
The theoretical curves of t , θ , cl , s , and S , as shown where C represents the necessarily positive energy
n
n
n
n
n
n
in Figures 6-9, suggest that these sequences are strictly balance entering the UOS and leaving its surface or lower
increasing and converge to finite limits. layers, and C is a positive constant.
If we denote the sequences in question by (t ), dyn
t
n
(θ ), (cl ), (s ), and (S ), they satisfy the following For any integer n, it follows that:
t
t
t
t
n
n
n
n
proposition: θ t n+3 > θ t n+2 (XI)
Volume 1 Issue 1 (2024) 9 doi: 10.36922/eer.4578