
Page 105 - EER-1-1
P. 105
Explora: Environment
and Resource Stratification and mixed layer deepening
3.2.2. Influence of the intertropical convergence zone 3.2.3. Role of the El Niño-Southern Oscillation
(ITCZ) The El Niño-La Niña provides the most plausible
The ITCZ is one such factor. explanation for the observed Markov-1 lengthening
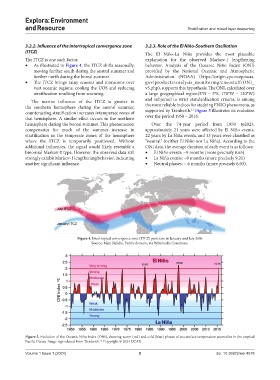
• As illustrated in Figure 4, the ITCZ shifts seasonally, behavior. Analysis of the Oceanic Niño Index (ONI)
moving further south during the austral summer and provided by the National Oceanic and Atmospheric
further north during the boreal summer. Administration (NOAA) (https://origin.cpc.ncep.noaa.
• The ITCZ brings rainy seasons and monsoons over gov/products/analysis_monitoring/ensostuff/ONI_
vast oceanic regions, cooling the UOS and reducing v5.php), supports this hypothesis. The ONI, calculated over
stratification resulting from warming. a large geographical region(5°N – 5°S, 170°W – 120°W)
The marine influence of the ITCZ is greater in and subjected to strict standardization criteria, is among
the southern hemisphere during the austral summer, the most reliable indices for studying ENSO phenomena, as
13
counteracting stratification increases intemperate zones of supported by Trenberth. Figure 5 illustrates its evolution
that hemisphere. A similar effect occurs in the northern over the period 1950 – 2016.
hemisphere during the boreal summer. This phenomenon Over the 74-year period from 1950 to2023,
compensates for much of the summer increase in approximately 21 years were affected by El Niño events,
stratification in the temperate zones of the hemisphere 22 years by La Niña events, and 33 years were classified as
where the ITCZ is temporarily positioned. Without “neutral” (neither El Niño nor La Niña). According to the
additional influences, the signal would likely resemble a ONI data, the average duration of each event is as follows:
binomial Markov-0 type. However, the observed data still • El Niño events: ~9 months (more precisely 8.65)
strongly exhibit Markov-1 lengthening behavior, indicating • La Niña events: ~9 months (more precisely 9.21)
another significant influence. • Neutral phases: ~ 6 months (more precisely 6.03).
Figure 4. Intertropical convergence zone (ITCZ) positions in January and July 2006
Source: Mats Halldin, Public domain, via Wikimedia Commons.
Figure 5. Evolution of the Oceanic Niño Index (ONI), showing warm (red) and cold (blue) phases of sea surface temperature anomalies in the tropical
Pacific Ocean. Image reproduced from Trenberth. Copyright © 2024 UCAR
13
Volume 1 Issue 1 (2024) 5 doi: 10.36922/eer.4578