
Page 102 - EER-1-1
P. 102
Explora: Environment
and Resource Stratification and mixed layer deepening
(iii) Disruption of precipitation and river runoff: Climate these results prove accurate, they could significantly
change has altered precipitation patterns and increased alter the guidance provided to policymakers on
river discharge, leading to the formation of a less addressing climate change.
salty surface layer. This layer becomes more isolated
from deeper waters, with salinity changes playing an 2. Materials and methods
important role primarily at local scales compared to 2.1. Schematic description of ocean stratification
the global impact of surface warming. 1-6
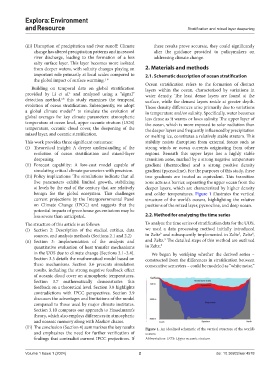
Ocean stratification refers to the formation of distinct
Building on temporal data on global stratification layers within the ocean, characterized by variations in
provided by Li et al. and analyzed using a “signal” water density. The least dense layers are found at the
1
detection method, this study examines the temporal surface, while the densest layers reside at greater depth.
7,8
evolution of ocean stratification. Subsequently, we adopt These density differences arise primarily due to variations
a global climate model to simulate the evolution of in temperature and/or salinity. Specifically, water becomes
7,8
global averages for key climate parameters: atmospheric less dense as it warms or loses salinity. The upper layer of
temperature at ocean level, upper oceanic stratum (UOS) the ocean, which is more exposed to solar radiation than
temperature, oceanic cloud cover, the deepening of the the deeper layers and frequently influenced by precipitation
mixed layer, and oceanic stratification. or melting ice, constitutes a relatively stable stratum. This
This work provides three significant outcomes: stability resists disruption from external forces such as
(i) Theoretical insight: A deeper understanding of the strong winds or ocean currents originating from other
evolution of ocean stratification and mixed-layer regions. Beneath this upper layer lies a highly stable
deepening. transition zone, marked by a strong negative temperature
(ii) Forecast capability: A low-cost model capable of gradient (thermocline) and a strong positive density
simulating critical climate parameters with precision. gradient (pycnocline). For the purposes of this study, these
(iii) Policy implications: The simulations indicate that all two gradients are treated as equivalent. This transition
five parameters exhibit limited growth, stabilizing zone acts as a barrier, separating the upper ocean from the
at levels by the end of the century that are relatively deeper layers, which are characterized by higher density
benign for the global ecosystem. This challenges and colder temperatures. Figure 1 illustrates the vertical
current projections by the Intergovernmental Panel structure of the world’s oceans, highlighting the relative
on Climate Change (IPCC) and suggests that the positions of the mixed layer, pycnocline, and deep ocean.
potential impacts of greenhouse gas emissions may be
less severe than anticipated. 2.2. Method for analyzing the time series
The structure of this article is as follows: To analyze the time series of stratification data for the UOS,
(i) Section 2: Description of the studied entities, data we used a data processing method initially introduced
9
8
7
sources, and analysis methods (Sections 2.1 and 2.2) in Zeltz and subsequently implemented in Zeltz , Zeltz ,
9
(ii) Section 3: Implementation of the analysis and and Zeltz. The detailed steps of this method are outlined
quantitative evaluation of heat transfer mechanisms in Zeltz. 8
in the UOS due to climate change (Sections 3.1–3.4). We began by verifying whether the derived series –
Section 3.5 details the mathematical model based on constructed from the differences in stratification between
these mechanisms. Section 3.6 presents simulation consecutive semesters – could be modeled as “white noise,”
results, including the strong negative feedback effect
of oceanic cloud cover on atmospheric temperatures.
Section 3.7 mathematically demonstrates this
feedback on a theoretical level. Section 3.8 highlights
contradictions with IPCC perspectives. Section 3.9
discusses the advantages and limitations of the model
compared to those used by major climate institutes.
Section 3.10 compares our approach to Hasselmann’s
theory, which also employs differences in atmospheric
and oceanic memory along with Markov chains.
(iii) The conclusion (Section 4) summarizes the key results Figure 1. An idealized schematic of the vertical structure of the world’s
and emphasizes the need for further verification of oceans
findings that contradict current IPCC projections. If Abbreviation: UOS: Upper oceanic stratum.
Volume 1 Issue 1 (2024) 2 doi: 10.36922/eer.4578