
Page 104 - EER-1-1
P. 104
Explora: Environment
and Resource Stratification and mixed layer deepening
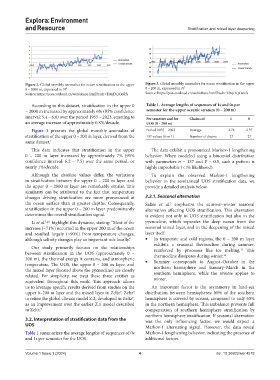
Figure 2. Global monthly anomalies for ocean stratification in the upper Figure 3. Global monthly anomalies for ocean stratification in the upper
0 – 2000 m, expressed in N² 0 – 200 m, expressed in N²
Source: https://pan.cstcloud.cn/web/share.html?hash=E0zjDQOeRfs Source: https://pan.cstcloud.cn/web/share.html?hash=E0zjDQOeRfs
According to this dataset, stratification in the upper 0 Table 1. Average lengths of sequences of 1s and 0s per
– 2000 m increased by approximately 6% (95% confidence semester for the upper oceanic stratum (0 – 200 m)
interval: 5.4 – 6.6) over the period 1955 – 2023, equating to Per semester and for Chains of 1 0
an average increase of approximately 0.8%/decade. UOS (0 – 200 m)
Figure 3 presents the global monthly anomalies of Period 1955 – 2023 Average 2.74 2.37
stratification of the upper 0 – 200 m layer, derived from the 137 values (0 or 1) Number of chains 27 27
same dataset. 1
This data indicates that stratification in the upper The data exhibit a pronounced Markov-1 lengthening
0 – 200 m layer increased by approximately 7% (95% behavior. When modeled using a binomial distribution
confidence interval: 6.2 – 7.5) over the same period, or with parameters n = 137 and P = 0.5, such a pattern is
nearly 1%/decade. highly improbable (<1% likelihood).
Although the absolute values differ, the variations To explain the observed Markov-1 lengthening
in stratification between the upper 0 – 200 m layer and behavior in the semiannual UOS stratification data, we
the upper 0 – 2000 m layer are remarkably similar. This provide a detailed analysis below.
similarity can be attributed to the fact that temperature
changes driving stratification are more pronounced at 3.2.1. Seasonal alternation
the ocean surface than at greater depths. Consequently, Sallée et al. emphasize the summer-winter seasonal
2
stratification in the upper 0 – 200 m layer predominantly alternation affecting UOS stratification. This alternation
determines the overall stratification signal. is evident not only in UOS stratification but also in the
Li et al. 1,p.1 highlight this dynamic, stating: “Most of the pycnocline, which separates the deep ocean from the
increase (~71%) occurred in the upper 200 m of the ocean seasonal mixed layer, and in the deepening of the mixed
and resulted largely (>90%) from temperature changes, layer itself.
although salinity changes play an important role locally.” • In temperate and cold regions, the 0 – 200 m layer
exhibits a seasonal thermocline during summer,
Our study primarily focuses on the relationships 11
between stratification in the UOS (approximately 0 – reinforced by processes like ice melting. This
thermocline dissipates during winter.
12
200 m), the thermal energy it contains, and atmospheric • Summer corresponds to August–October in the
temperature. The UOS, the upper 0 – 200 m layer, and
the mixed layer (located above the pycnocline) are closely northern hemisphere and January–March in the
related. For simplicity, we treat these three entities as southern hemisphere, while the reverse applies to
winter.
equivalent throughout this work. This approach allows
us to leverage specific results derived from studies on the An important factor is the asymmetry in land-sea
upper 0–200 m layer and the mixed layer in Zeltz , Zeltz distribution between hemispheres: 80% of the southern
7
8
to refine the global climate model Z.2, developed in Zeltz , hemisphere is covered by oceans, compared to only 60%
8
as an improvement over the earlier Z.1 model described in the northern hemisphere. This imbalance prevents full
in Zeltz. 7 compensation of southern hemisphere stratification by
northern hemisphere stratification. If seasonal alternation
3.2. Interpretation of stratification data from the was the only influencing factor, we would expect a
UOS Markov-1 alternating signal. However, the data reveal
Table 1 summarizes the average lengths of sequences of 0s Markov-1 lengthening behavior, indicating the presence of
and 1s per semester for the UOS. additional factors.
Volume 1 Issue 1 (2024) 4 doi: 10.36922/eer.4578