
Page 36 - EER-1-1
P. 36
Explora: Environment
and Resource WTW emissions of road, rail, sea, and air transport
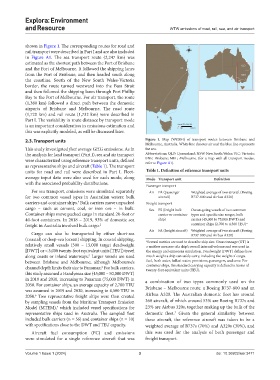
shown in Figure 1. The corresponding routes for road and
rail transport were described in Part I and are also included
in Figure A1. The sea transport route (2,247 km) was
estimated as the shortest path between the Port of Brisbane
and the Port of Melbourne. It followed the shipping lanes
from the Port of Brisbane, and then headed south along
the coastline. South of the New South Wales-Victoria
border, the route turned westward into the Bass Strait
and then followed the shipping lanes through Port Phillip
Bay to the Port of Melbourne. For air transport, the route
(1,380 km) followed a direct path between the domestic
airports of Brisbane and Melbourne. The road route
(1,720 km) and rail route (1,732 km) were described in
Part I. The variability in route distance by transport mode
is an important consideration in emissions estimation and
this was explicitly modeled, as will be discussed later.
2.3. Transport units Figure 1. Map (WGS84) of transport routes between Brisbane and
Melbourne, Australia. White line denotes air and the blue line represents
This study investigated fleet average GHG emissions. As in the sea.
the analysis for land transport (Part I), sea and air transport Abbreviations: QLD: Queensland; NSW: New South Wales; VIC: Victoria;
were characterized using reference transport units, defined BNE: Brisbane; MEL: Melbourne. (for a map with all transport modes,
refer to Figure A1).
as representative ships and aircraft (Table 1). The transport
units for road and rail were described in Part I. Fleet- Table 1. Definition of reference transport units
average input data were also used for each mode, along Mode Transport unit Definition
with the associated probability distributions. Passenger transport
For sea transport, emissions were simulated separately Air PA (passenger Weighted average of two aircraft (Boeing
for two common vessel types in Australian waters: bulk aircraft) B737-800 and Airbus A320)
carriers and container ships. Bulk carriers move unpacked Freight transport
4
cargo – such as cement, coal, or iron ore – in bulk. Sea FS (freight bulk Ocean-going vessels of two common
Container ships move packed cargo in standard 20-foot or carrier or container types and specific size ranges, bulk
40-foot containers. In 2018 – 2019, 93% of domestic sea ship) carrier (45,000 to 75,000 DWT) and
freight in Australia involved bulk cargo. 2 container ships (2,700 to 4,500 TEU) a
Air FA (freight aircraft) Weighted average of two aircraft (Boeing
Cargo can also be transported by either short-sea B737-800 and Airbus A320)
(coastal) or deep-sea (ocean) shipping. In coastal shipping, a Several metrics are used to describe ship size. Gross tonnage (GT) is
relatively small vessels (500 – 15,000 target deadweight a unitless measure of a ship’s overall internal volume and was used in
[DWT] or < 3,000 twenty-foot equivalent units [TEU]) travel the energy and emissions simulation. Deadweight (DWT) defines how
along coasts or inland waterways. Larger vessels are used much weight a ship can safely carry, including the weight of cargo,
5
between Brisbane and Melbourne, although Melbourne’s fuel, fresh water, ballast water, provisions, passengers, and crew. For
channel depth limits their size to Panamax. For bulk carriers, container ships, the standard carrying capacity is defined in terms of
6
twenty-foot equivalent units (TEU).
this study assumed a Handymax size (45,000 – 50,000 DWT)
in 2019 and 2030, increasing to Panamax (75,000 DWT) in a combination of two types commonly used on the
2050. For container ships, an average capacity of 2,700 TEU Brisbane – Melbourne route: a Boeing B737-800 and an
was assumed in 2019 and 2030, increasing to 4,500 TEU in
2050. Two representative freight ships were then created Airbus A320. The Australian domestic fleet has around
6
by sampling vessels from the Maritime Transport Emission 360 aircraft, of which around 53% are Boeing B737s and
Model (MTEM), which included vessel specifications for 23% are Airbus 320s, together making up the bulk of the
4
representative ships used in Australia. The sampled fleet domestic fleet. Given the general similarity between
7
included bulk carriers (n = 56) and container ships (n = 10) these aircraft, the reference aircraft was taken to be a
with specifications close to the DWT and TEU capacity. weighted average of B737s (70%) and A320s (30%), and
Aircraft fuel consumption (FC) and emissions this was used for the analysis of both passenger and
were simulated for a single reference aircraft that was freight transport.
Volume 1 Issue 1 (2024) 3 doi: 10.36922/eer.3471