
Page 37 - EER-1-1
P. 37
Explora: Environment
and Resource WTW emissions of road, rail, sea, and air transport
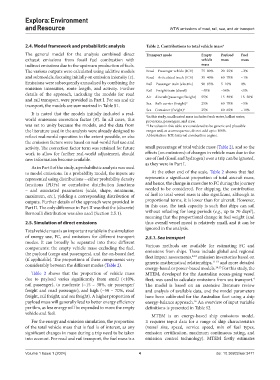
2.4. Model framework and probabilistic analysis Table 2. Contributions to total vehicle mass*
The general model for the analysis combined direct Transport mode Empty Payload Fuel
exhaust emissions from fossil fuel combustion with vehicle mass mass
indirect emissions due to the upstream production of fuels. mass
The various outputs were calculated using additive models Road – Passenger vehicle (ICE) 75–80% 20–25% ~2%
and submodels, focusing initially on emission intensity (ε). Road – Articulated truck (ICE) 35–40% 60–70% ~1%
Emissions were subsequently annualized by combining the Rail – Passenger train (electric) 90–95% 5–10% 0%
emission intensities, route length, and activity. Further Rail – Freight train (diesel) ~50% ~50% <1%
details of the approach, including the models for road
and rail transport, were provided in Part I. For sea and air Air – Aircraft (passenger/freight) 55% 15–30% 15–30%
transport, the models are summarized in Table S1. Sea – Bulk carrier (freight) a 25% 60–70% ~5%
Sea – Container (freight) a 25% 60–65% ~10%
It is noted that the models initially included a real- a
In this study, unallocated mass includes fresh water, ballast water,
world emissions correction factor (σ). In all cases, this provisions, passengers, and crew.
was set to unity because the models, and the data from *The values in this table are considered to be generic and plausible
the literature used in the analysis were already designed to ranges and, as a consequence, do not add up to 100%.
reflect real-world operation to the extent possible, or else Abbreviation: ICE: Internal combustion engine.
the emission factors were based on real-world fuel use and
activity. The correction factor term was retained for future small percentage of total vehicle mass (Table 2), and so the
work to allow for further real-world adjustment, should effects (on emissions) of changes in vehicle mass due to the
new information become available. use of fuel (fossil and hydrogen) over a trip can be ignored,
as they were in Part I.
As in Part I of the study, a probabilistic analysis was used
to model emissions. In a probability model, the inputs are At the other end of the scale, Table 2 shows that fuel
represented using distributions – either probability density represents a significant proportion of total aircraft mass,
functions (PDFs) or cumulative distribution functions and hence, the change in mass due to FC during the journey
– and associated parameters (scale, shape, minimum, needed to be considered. For shipping, the contribution
maximum, etc.), yielding a corresponding distribution of of fuel to total vessel mass is also significant, although in
outputs. Further details of the approach were provided in proportional terms, it is lower than for aircraft. However,
Part II. The only difference in Part II was that the (discrete) in this case, the tank capacity is such that ships can sail
5
Bernoulli distribution was also used (Section 2.5.1). without refueling for long periods (e.g., up to 70 days ),
meaning that the proportional change in fuel weight (and
2.5. Simulation of direct emissions thus overall vessel mass) is relatively small, and it can be
ignored in the analysis.
Total vehicle mass is an important variable in the simulation
of energy use, FC, and emissions for different transport 2.5.1. Sea transport
modes. It can broadly be separated into three different
components: the empty vehicle mass excluding the fuel, Various methods are available for estimating FC and
the payload (cargo and passengers), and the on-board fuel emissions from ships. These include global and regional
fleet impact assessments,
8-10
emission inventories based on
(if applicable). The proportions of these components vary generic mathematical relationships, 11-13 and more detailed
considerably between the different modes (Table 2).
energy-based or power-based models. 14,15 For this study, the
Table 2 shows that the proportion of vehicle mass MTEM, developed for the Australian ocean-going vessel
due to payload varies significantly from small (<10%, fleet, was used to calculate emissions from sea transport.
4
rail passenger), to moderate (~15 – 30%, air passenger/ The model is based on an extensive literature review
freight and road passenger), and high (~50 – 70%, road and analysis of available data, and the model parameters
freight, rail freight, and sea freight). A higher proportion of have been calibrated for the Australian fleet using a ship
payload mass will generally lead to better energy efficiency energy-balance approach. An overview of input variable
16
per tkm, as less energy will be expended to move the empty definitions is presented in Table S2.
vehicle and fuel.
MTEM is an energy-based ship emissions model.
For the energy and emission simulation, the proportion It requires input data for a range of ship characteristics
of the total vehicle mass that is fuel is of interest, as any (vessel size, speed, service speed, mix of fuel types,
significant changes in mass during a trip need to be taken emission certification, maximum continuous rating, and
into account. For road and rail transport, the fuel mass is a emission control technology). MTEM firstly estimates
Volume 1 Issue 1 (2024) 4 doi: 10.36922/eer.3471