
Page 42 - EER-1-1
P. 42
Explora: Environment
and Resource WTW emissions of road, rail, sea, and air transport
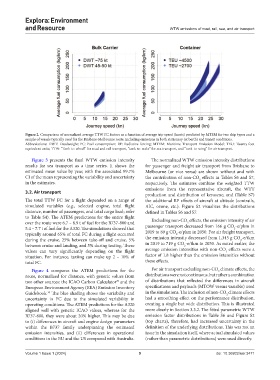
Figure 2. Comparison of normalized average TTW FC factors as a function of average trip speed (knots) predicted by MTEM for two ship types and a
sample of vessels typically used for the Brisbane-Melbourne route, including emissions in both stationary (at berth) and transit conditions.
Abbreviations: DWT: Deadweight; FC: Fuel consumption; RF: Radiative forcing; MTEM: Maritime Transport Emission Model; TEU: Twenty-foot
equivalent units; TTW: “Tank-to-wheel” for road and rail transport, “tank-to-wake” for sea transport, and “tank-to-wing” for air transport.
Figure 3 presents the final WTW emission intensity The normalized WTW emission intensity distributions
results for sea transport as a time series. It shows the for passenger and freight air transport from Brisbane to
estimated mean value by year, with the associated 99.7% Melbourne (or vice versa) are shown without and with
CI of the mean representing the variability and uncertainty the contribution of non-CO effects in Tables S6 and S7,
2
in the estimates. respectively. The estimates combine the weighted TTW
emissions from the representative aircraft, the WTT
3.2. Air transport production and distribution of kerosene, and (Table S7)
The total TTW FC for a flight depended on a range of the additional RF effects of aircraft at altitude (contrails,
simulated variables (e.g., selected engine, total flight AIC, ozone, etc.). Figure S2 visualizes the distributions
distance, number of passengers, and total cargo load; refer defined in Tables S6 and S7.
to Table S4). The ATEM predictions for the entire flight Excluding non-CO effects, the emission intensity of air
over the route were 6.7 – 8.9 t of fuel for the B737-800 and 2
5.4 – 7.7 t of fuel for the A320. The simulations showed that passenger transport decreased from 166 g CO -e/pkm in
2
typically around 65% of total FC during a flight occurred 2019 to 89 g CO -e/pkm in 2050. For air freight transport,
2
during the cruise, 25% between take-off and cruise, 5% the emission intensity decreased from 1,345 g CO -e/tkm
2
between cruise and landing, and 5% during taxiing. These in 2019 to 719 g CO -e/tkm in 2050. As noted earlier, the
2
values can vary significantly depending on the flight average emission intensities with non-CO effects were a
2
situation. For instance, taxiing can make up 2 – 10% of factor of 1.8 higher than the emission intensities without
total FC. these effects.
Figure 4 compares the ATEM predictions for the For air transport excluding non-CO climate effects, the
2
route, normalized for distance, with generic values from distributions were not continuous, but rather a combination
two other sources: the ICAO Carbon Calculator and the of distributions that reflected the differences in aircraft
29
European Environment Agency (EEA) Emission Inventory specifications and payloads (MTOW versus variable) used
30
Guidebook. The blue shading shows the variability and in the simulations. The inclusion of non-CO climate effects
2
uncertainty in FC due to the simulated variability in had a smoothing effect on the performance distribution,
operating conditions. The ATEM predictions for the A320 creating a single but wide distribution. This is illustrated
aligned well with generic ICAO values, whereas for the more clearly in Section 3.3.2. The fitted parametric WTW
B737-800, they were about 20% higher. This may be due emission factor distributions in Table S6 and Figure S2
to (i) differences in aircraft and engine design parameters (top charts), therefore, had increased uncertainty in the
within the B737 family underpinning the estimated definition of the underlying distributions. This was not an
emission intensities, and (ii) differences in operational issue in the simulation itself, where actual simulated values
conditions in the EU and the US compared with Australia. (rather than parametric distributions) were used directly.
Volume 1 Issue 1 (2024) 9 doi: 10.36922/eer.3471