
Page 45 - EER-1-1
P. 45
Explora: Environment
and Resource WTW emissions of road, rail, sea, and air transport
would result in lower emissions. The emission intensity of 3.3.2. Freight transport
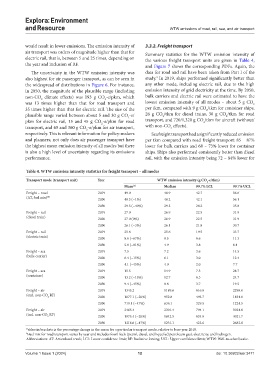
air transport was orders of magnitude higher than that for Summary statistics for the WTW emission intensity of
electric rail, that is, between 5 and 25 times, depending on the various freight transport units are given in Table 4,
the year and inclusion of RF. and Figure 7 shows the corresponding PDFs. Again, the
The uncertainty in the WTW emission intensity was data for road and rail have been taken from Part I of the
3
also highest for air passenger transport, as can be seen in study. In 2019, ships performed significantly better than
the widespread of distributions in Figure 6. For instance, any other mode, including electric rail, due to the high
in 2050, the magnitude of the plausible range (including emission intensity of grid electricity at the time. By 2050,
non-CO climate effects) was 193 g CO -e/pkm, which bulk carriers and electric rail were estimated to have the
2
2
was 13 times higher than that for road transport and lowest emission intensity of all modes – about 5 g CO
2
35 times higher than that for electric rail. The size of the per tkm, compared with 9 g CO /tkm for container ships,
2
plausible range varied between about 5 and 30 g CO -e/ 26 g CO /tkm for diesel trains, 30 g CO /tkm for road
2
2
2
pkm for electric rail, 15 and 45 g CO -e/pkm for road transport, and 720/1,320 g CO /tkm for aircraft (without/
2
2
transport, and 65 and 360 g CO -e/pkm for air transport, with non-CO effects).
2
2
respectively. This is relevant information for policy-makers Sea freight transport had a significantly reduced emission
and planners; not only does air passenger transport have per tkm compared with road freight transport: 85 – 87%
the highest mean emission intensity of all modes but there lower for bulk carriers and 68 – 73% lower for container
is also a high level of uncertainty regarding its emissions ships. Ships also performed consistently better than diesel
performance. rail, with the emission intensity being 72 – 84% lower for
Table 4. WTW emission intensity statistics for freight transport – all modes
Transport mode (transport unit) Year WTW emission intensity (g CO ‑e/tkm)
2
Mean (a) Median 99.7% LCL 99.7% UCL
Freight – road 2019 49.0 48.9 42.7 56.6
(AT, fuel mix) (b) 2030 48.3 (−1%) 48.2 42.1 56.1
2050 29.5 (−40%) 29.5 24.2 35.8
Freight – rail 2019 27.0 26.9 22.5 31.9
(diesel train) 2030 27.0 (0%) 26.9 22.5 31.9
2050 26.1 (−3%) 26.1 21.8 30.7
Freight – rail 2019 25.8 25.6 19.5 33.7
(electric train) 2030 8.6 (−67%) 8.5 6.6 11.3
2050 5.0 (−81%) 4.9 3.8 6.4
Freight – sea 2019 7.5 7.2 3.6 14.5
(bulk-carrier) 2030 6.4 (−15%) 6.1 3.0 12.4
2050 4.1 (−45%) 4.0 2.0 7.7
Freight – sea 2019 15.5 14.9 7.5 28.7
(container) 2030 13.2 (−15%) 12.7 6.3 24.7
2050 9.4 (−45%) 8.8 3.7 19.5
Freight – air 2019 1345.2 1189.6 616.6 2290.0
(excl. non-CO RF) 2030 1077.1 (−20%) 952.8 493.7 1834.0
2
2050 719.1 (−47%) 636.1 329.5 1224.5
Freight – air 2019 2465.4 2301.4 794.1 5024.8
(incl. non-CO RF)
2 2030 1975.4 (−20%) 1842.5 634.0 4021.7
2050 1318.6 (−47%) 1231.1 423.6 2682.8
a Value in brackets is the percentage change in the mean for a particular transport mode, relative to base year 2019.
b Fuel mix for road transport varies by year and includes fossil fuels (petrol, diesel, and liquefied petroleum gas), electricity, and hydrogen.
Abbreviations: AT: Articulated truck; LCL: Lower confidence limit; RF: Radiative forcing; UCL: Upper confidence limit; WTW: Well-to-wheel/wake.
Volume 1 Issue 1 (2024) 12 doi: 10.36922/eer.3471