
Page 48 - EER-1-1
P. 48
Explora: Environment
and Resource WTW emissions of road, rail, sea, and air transport
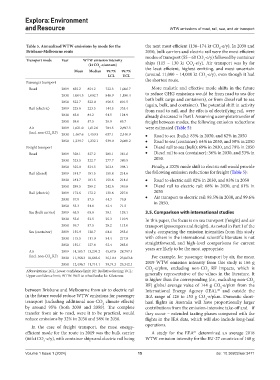
Table 5. Annualized WTW emissions by mode for the the next most efficient (136–174 kt CO -e/y). In 2030 and
2
Brisbane‑Melbourne route 2050, bulk carriers and electric rail were the most efficient
modes of transport (55 – 60 CO -e/y) followed by container
Transport mode Year WTW emission intensity 2
(kt CO ‑e/annum) ships (115 – 130 kt CO -e/y). Air transport was by far
2
2 the least efficient, highest emitting, and most uncertain
Mean Median 99.7% 99.7%
LCL UCL (around 11,000 – 14,000 kt CO -e/y), even though it had
2
Passenger transport the shortest route.
Road 2019 855.2 854.2 722.3 1,006.7 More realistic and effective mode shifts in the future
2030 1,004.5 1,002.7 846.9 1,180.4 to reduce GHG emissions would be from road to sea (for
2050 522.7 522.0 456.5 601.5 both bulk cargo and containers), or from diesel rail to sea
(again, bulk, and container). The potential shift in activity
Rail (electric) 2019 225.6 223.5 144.5 335.4
from road to rail, and the effects of electrifying rail, were
2030 85.0 84.2 54.5 124.9 already discussed in Part I. Assuming a complete transfer of
2050 58.0 57.5 36.9 85.7 freight between modes, the following emission reductions
Air 2019 1,621.0 1,612.0 704.5 2,697.5 were estimated (Table 5):
(incl. non-CO RF)
2 2030 1,467.6 1,459.5 637.1 2,440.9 • Road to sea (bulk): 83% in 2030, and 82% in 2050
2050 1,239.7 1,232.1 539.0 2,060.2 • Road to sea (container): 64% in 2030, and 58% in 2050
Freight transport • Diesel rail to sea (bulk): 69% in 2030, and 79% in 2050
Road 2019 328.1 327.2 281.1 381.6 • Diesel rail to sea (container): 36% in 2030, and 53% in
2030 323.5 322.7 277.7 380.5 2050.
2050 325.0 324.3 263.4 398.1 Finally, a 100% mode shift to electric rail would provide
Rail (diesel) 2019 181.7 181.5 151.8 214.6 the following emission reductions for freight (Table 5):
2030 181.7 181.5 151.8 214.6 • Road to electric rail: 82% in 2030, and 83% in 2050
2050 289.5 289.2 242.6 340.8 • Diesel rail to electric rail: 68% in 2030, and 81% in
Rail (electric) 2019 173.6 172.2 131.8 227.0 2050
2030 57.9 57.5 44.3 75.8 • Air transport to electric rail: 99.5% in 2030, and 99.6%
in 2050.
2050 55.3 54.8 42.4 71.5
Sea (bulk carrier) 2019 65.5 63.0 30.1 129.1 3.5. Comparison with international studies
2030 55.6 53.5 25.3 110.9 In this paper, the focus is on sea transport (freight) and air
2050 59.7 57.5 28.2 113.0 transport (passengers and freight). As noted in Part I of the
Sea (container) 2019 135.9 130.7 64.6 253.6 study, comparing the emission intensities from this study
2030 115.5 111.0 54.4 217.8 with others in the international scientific literature is not
2050 135.1 127.4 52.4 283.0 straightforward, and high-level comparisons for current
Air 2019 14,185.7 13,294.2 45,07.8 28,797.4 years are likely to be the most appropriate.
(incl. non-CO RF) 2030 11,366.3 10,643.6 36,10.4 23,063.8 For example, for passenger transport by air, the mean
2
2050 12,496.7 11,714.1 39,74.3 25,342.1 2019 WTW emission intensity from this study is 166 g
CO -e/pkm, excluding non-CO RF impacts, which is
Abbreviations: LCL: Lower confidence limit; RF: Radiative forcing; UCL: generally representative of the values in the literature. It
2
2
Upper confidence limit; WTW: Well-to-wheel/wake; kt: Kilotonne.
is higher than the corresponding (i.e., excluding non-CO
2
RF) global average value of 144 g CO -e/pkm from the
2
between Brisbane and Melbourne from air to electric rail International Energy Agency (IEA), and outside the
60
in the future would reduce WTW emissions for passenger IEA range of 126 to 153 g CO -e/pkm. Domestic short-
2
transport (including additional non-CO climate effects) haul flights in Australia will have proportionally larger
2
by around 95% (both 2030 and 2050). The complete contributions from the emission-intensive take-off and – if
transfer from air to road, were it to be practical, would they occur – extended taxiing phases compared with the
reduce emissions by 32% in 2030 and 58% in 2050. flights in the IEA data, which will also include long-haul
In the case of freight transport, the most energy- operations.
efficient mode for the route in 2019 was the bulk carrier A study for the EEA determined an average 2018
61
(66 kt CO -e/y), with container ships and electric rail being WTW emission intensity for the EU-27 countries of 160 g
2
Volume 1 Issue 1 (2024) 15 doi: 10.36922/eer.3471