
Page 44 - EER-1-1
P. 44
Explora: Environment
and Resource WTW emissions of road, rail, sea, and air transport
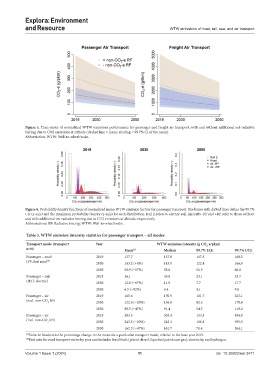
Figure 5. Time-series of normalized WTW emissions performance for passenger and freight air transport, with and without additional net radiative
forcing due to CO2 emissions at altitude (dashed line = mean; shading = 99.7% CI of the mean).
Abbreviation: WTW: Well-to-wheel/wake.
Figure 6. Probability density functions of normalized mean WTW emission factors for passenger transport. The boxes with dotted lines define the 99.7%
CIs (x-axis) and the maximum probability density (y-axis) for each distribution. Rail E refers to electric rail. Aircrafts -RF and +RF refer to those without
and with additional net radiative forcing due to CO2 emissions at altitude, respectively.
Abbreviations: RF: Radiative forcing; WTW: Well-to-wheel/wake.
Table 3. WTW emission intensity statistics for passenger transport – all modes
Transport mode (transport Year WTW emission intensity (g CO ‑e/pkm)
2
unit) Mean (a) Median 99.7% LCL 99.7% UCL
Passenger – road 2019 137.7 137.6 117.5 160.5
(PV, fuel mix) (b) 2030 143.2 (+4%) 143.0 122.4 166.0
2050 58.9 (−57%) 58.8 51.9 66.8
Passenger – rail 2019 36.1 35.8 23.1 53.7
(HST, electric) 2030 12.0 (−67%) 11.9 7.7 17.7
2050 6.5 (−82%) 6.4 4.1 9.6
Passenger – air 2019 165.6 170.9 101.7 223.1
(excl. non-CO RF)
2 2030 132.6 (−20%) 136.8 81.5 178.6
2050 88.5 (−47%) 91.4 54.3 119.2
Passenger – air 2019 303.5 302.4 133.5 494.0
(incl. non-CO RF) 2030 243.2 (−20%) 242.3 106.8 395.5
2
2050 162.3 (−47%) 161.7 71.4 264.1
(a) Value in brackets is the percentage change in the mean for a particular transport mode, relative to the base year 2019.
(b) Fuel mix for road transport varies by year and includes fossil fuels (petrol, diesel, liquefied petroleum gas), electricity, and hydrogen.
Volume 1 Issue 1 (2024) 11 doi: 10.36922/eer.3471