
Page 47 - EER-1-1
P. 47
Explora: Environment
and Resource WTW emissions of road, rail, sea, and air transport
The uncertainty in the WTW emission intensity was show a gradual decline in GHG emissions, land transport
also the highest for air transport, as can be seen in the (rail and road) shows a more non-linear trajectory.
widespread of distributions in Figure 7. The size of the Road transport is expected to significantly improve its
plausible range varied between a relatively narrow 3 – 14 g performance after 2030 when zero- and low-emission
CO -e/pkm for electric rail, 8 – 9 CO -e/pkm for diesel rail vehicles start to penetrate the on-road fleet at an accelerated
2
2
and 6 – 11 g CO -e/pkm for bulk carriers, to a wider 12–14 g rate. In contrast, electric rail is decarbonizing much faster,
2
CO -e/pkm for road transport, and 16–21 g CO -e/pkm for in line with the decarbonization of the electricity grid. This
2
2
container ships to a very wide 895 – 4,231 g CO -e/pkm for shows an additional important benefit of electric rail over
2
air transport. In 2050, the plausible range for air transport the other transport modes: it decarbonizes faster than the
(including additional non-CO climate effects) was 2,259 g other modes and will, therefore, prevent a large portion of
2
CO -e/pkm, which was 195 times higher than that for road the cumulative GHG emission loads associated with the
2
transport and 863 times higher than that for electric rail. other transport modes.
3.3.3. Summary of time-series by mode 3.4. Annualized emissions
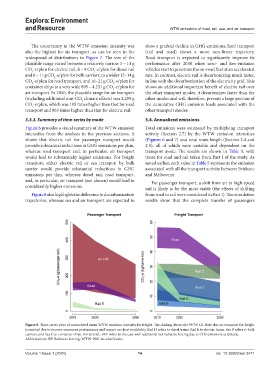
Figure 8 provides a visual summary of the WTW emission Total emissions were estimated by multiplying transport
intensities from the analysis in the previous sections. It activity (Section 2.7) by the WTW emission intensities
shows that electric rail for passenger transport would (Figures 6 and 7) and total route length (Section 2.4 and
provide substantial reductions in GHG emissions per pkm, 2.5), all of which were variable and dependent on the
whereas road transport and, in particular, air transport transport mode. The results are shown in Table 5, with
would lead to substantially higher emissions. For freight those for road and rail taken from Part I of the study. As
transport, either electric rail or sea transport by bulk noted earlier, each value in Table 5 represents the emission
carrier would provide substantial reductions in GHG associated with all the transport activity between Brisbane
emissions per tkm, whereas diesel rail, road transport, and Melbourne.
and, in particular, air transport (not shown) would lead to For passenger transport, a shift from air to high-speed
considerably higher emissions. rail is likely to be the most viable (the effects of shifting
Figure 8 also highlights the difference in decarbonization from road to rail were considered in Part I). The simulation
trajectories, whereas sea and air transport are expected to results show that the complete transfer of passengers
Figure 8. Time-series plots of normalized mean WTW emission intensity for freight. The shading shows the 99.7% CI. Note that air transport for freight
is omitted due to its poor emissions performance and impact on chart readability. Rail D refers to diesel trains, Rail E to electric trains, Sea B refers to bulk
carriers, and Sea C to container ships. For aircraft, +RF refers to the case with additional net radiative forcing due to CO2 emissions at altitude.
Abbreviations: RF: Radiative forcing; WTW: Well-to-wheel/wake.
Volume 1 Issue 1 (2024) 14 doi: 10.36922/eer.3471