
Page 46 - EER-1-1
P. 46
Explora: Environment
and Resource WTW emissions of road, rail, sea, and air transport
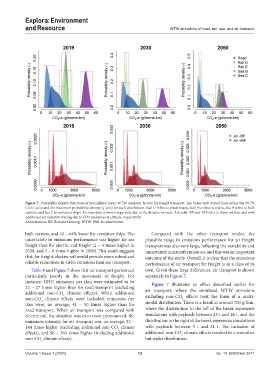
Figure 7. Probability density functions of normalized mean WTW emission factors for freight transport. The boxes with dotted lines define the 99.7%
CIs (x-axis) and the maximum probability density (y-axis) for each distribution. Rail D refers to diesel trains, Rail E to electric trains, Sea B refers to bulk
carriers, and Sea C to container ships. Air transport is shown separately due to the distance in scale. Aircrafts -RF and +RF refer to those without and with
additional net radiative forcing due to CO2 emissions at altitude, respectively.
Abbreviations: RF: Radiative forcing; WTW: Well-to-wheel/wake.
bulk carriers, and 43 – 64% lower for container ships. The Compared with the other transport modes, the
uncertainty in emissions performance was higher for sea plausible range in emissions performance for air freight
freight than for electric rail freight (2 – 4 times higher in transport was also very large, reflecting the variability and
2030, and 2 – 6 times higher in 2050). This result suggests uncertainty in aircraft emissions, and this was an important
that, for freight, electric rail would provide more robust and outcome of the study. Overall, it is clear that the emissions
reliable reductions in GHG emissions than sea transport. performance of air transport for freight is in a class of its
Table 4 and Figure 7 show that air transport performed own. Given these large differences, air transport is shown
particularly poorly in the movement of freight. For separately in Figure 7.
instance, GHG emissions per tkm were estimated to be Figure 7 illustrates an effect described earlier for
22 – 27 times higher than for road transport (excluding air transport, where the simulated WTW emissions
additional non-CO climate effects). When additional
2
non-CO climate effects were included, emissions per excluding non-CO effects took the form of a multi-
2
2
tkm were, on average, 41 – 50 times higher than for modal distribution. There is a break at around 700 g/tkm,
road transport. When air transport was compared with where the distribution to the left of the break represents
electric rail, the situation was even more pronounced; the simulations with payloads between 23 t and 26 t, and the
emissions intensity for air transport was, on average, 52 – distribution to the right of the break represents simulations
144 times higher (excluding additional non-CO climate with payloads between 9 t and 21 t. The inclusion of
2
effects), and 96 – 265 times higher (including additional additional non-CO climate effects resulted in a smoother
2
non-CO climate effects). but wider distribution.
2
Volume 1 Issue 1 (2024) 13 doi: 10.36922/eer.3471