
Page 43 - EER-1-1
P. 43
Explora: Environment
and Resource WTW emissions of road, rail, sea, and air transport
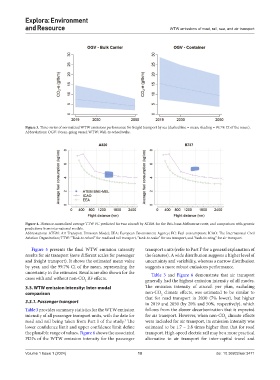
Figure 3. Time-series of normalized WTW emissions performance for freight transport by sea (dashed line = mean; shading = 99.7% CI of the mean).
Abbreviations: OGV: Ocean-going vessel; WTW: Well-to-wheel/wake.
Figure 4. Distance-normalized average TTW FC predicted for two aircraft by ATEM for the Bris-bane-Melbourne route, and comparison with generic
predictions from international models.
Abbreviations: ATEM: Air Transport Emission Model; EEA: European Environment Agency; FC: Fuel consumption; ICAO: The International Civil
Aviation Organization; TTW: “Tank-to-wheel” for road and rail transport, “tank-to-wake” for sea transport, and “tank-to-wing” for air transport.
Figure 5 presents the final WTW emission intensity transport units (refer to Part I for a general explanation of
3
results for air transport (note different scales for passenger the features). A wide distribution suggests a higher level of
and freight transport). It shows the estimated mean value uncertainty and variability, whereas a narrow distribution
by year, and the 99.7% CI of the mean, representing the suggests a more robust emissions performance.
uncertainty in the estimates. Results are also shown for the Table 3 and Figure 6 demonstrate that air transport
cases with and without non-CO RF effects. generally had the highest emission intensity of all modes.
2
3.3. WTW emission intensity: Inter-modal The emission intensity of aircraft per pkm, excluding
comparison non-CO climate effects, was estimated to be similar to
2
that for road transport in 2030 (7% lower), but higher
3.3.1. Passenger transport in 2019 and 2050 (by 20% and 50%, respectively), which
Table 3 provides summary statistics for the WTW emission follows from the slower decarbonization that is expected
intensity of all passenger transport units, with the data for for air transport. However, when non-CO climate effects
2
road and rail being taken from Part I of the study. The were included for air transport, its emission intensity was
3
lower confidence limit and upper confidence limit define estimated to be 1.7 – 2.8 times higher than that for road
the plausible range of values. Figure 6 shows the associated transport. High-speed electric rail may be a more practical
PDFs of the WTW emission intensity for the passenger alternative to air transport for inter-capital travel and
Volume 1 Issue 1 (2024) 10 doi: 10.36922/eer.3471