
Page 63 - EER-1-1
P. 63
Explora: Environment
and Resource COVID-19 impact on forest biodiversity attitudes
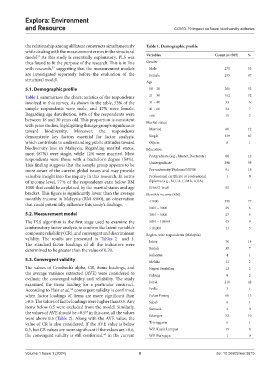
the relationship among all latent constructs simultaneously Table 1. Demographic profile
while dealing with the measurement errors in the structural
model As this study is essentially explanatory, PLS was Variables Count (n=505) %
57
thus found to fit the purpose of the research. This is in line Gender
with research, suggesting that the measurement models Male 270 53
57
are investigated separately before the evaluation of the Female 235 47
structural model. Age
5.1. Demographic profile 18 – 20 261 52
Table 1 summarizes the characteristics of the respondents 21 – 30 162 32
involved in this survey. As shown in the table, 53% of the 31 – 40 33 6
sample respondents were male, and 47% were female. 41 – 60 34 7
Regarding age distribution, 84% of the respondents were >60 15 3
between 18 and 30 years old. This proportion is consistent Marital status
with prior studies, highlighting this age group’s significance
toward biodiversity. Moreover, the respondents Married 60 12
demonstrate key factors essential for factor analysis, Single 439 87
which contribute to understanding public attitudes toward Others 6 1
biodiversity loss in Malaysia. Regarding marital status, Education
most (87%) were single, while 12% were married. Most Postgraduate (e.g., Master, Doctorate) 60 12
respondents were those with a bachelor’s degree (59%).
This finding suggests that the sample group appears to be Undergraduate 298 59
more aware of the current global issues and may provide Pre-university/Diploma/STPM 91 18
valuable insight into the inquiry in this research. In terms Professional certificate or professional 1 0
of income level, 77% of the respondents earn below RM diploma (e.g., ACCA, CIMA, ICSA)
1000 that could be explained by the marital status and age SPM/O-level 55 11
bracket. This figure is significantly lower than the average Monthly income (RM)
monthly income in Malaysia (RM 6500), an observation <1000 391 77
that could potentially influence this study’s findings.
1001 – 3000 29 6
5.2. Measurement model 3001 – 5000 27 5
The PLS algorithm is the first stage used to examine the 5001 – 10,000 45 9
confirmatory factor analysis to confirm the latent variable’s >10,000 13 3
composite reliability (CR), and convergent and discriminant Region-wise respondents (Malaysia)
validity. The results are presented in Tables 2 and 3. Johor 70 14
The standard factor loadings of all the indicators were
determined to be greater than the value of 0.70. Kedah 35 7
Kelantan 4 1
5.3. Convergent validity Melaka 11 2
The values of Cronbach’s alpha, CR, items loadings, and Negeri Sembilan 12 2
the average variance extracted (AVE) were considered to Pahang 8 2
evaluate the converged validity and reliability. The study
examined the items loading for a particular construct. Perak 210 42
According to Hair et al., convergent validity is confirmed Perlis 3 1
58
when factor loadings of items are more significant than Pulau Pinang 66 13
>0.5. The values of factor loadings were higher than 0.5. Any Sabah 6 1
items below 0.5 were excluded from the model. Similarly, Sarawak 2 0
the values of AVE should be >0.5 in this case, all the values Selangor 52 10
58
were above 0.5 (Table 2). Along with the AVE value, the
value of CR is also considered. If the AVE value is below Terengganu 6 1
0.5, but CR values are more significant if the values are >0.6, W.P. Kuala Lumpur 19 4
the convergent validity is still confirmed. In the current W.P. Putrajaya 1 0
60
Volume 1 Issue 1 (2024) 8 doi: 10.36922/eer.3615