
Page 76 - EER-1-1
P. 76
Explora: Environment
and Resource Climate change and apple yield
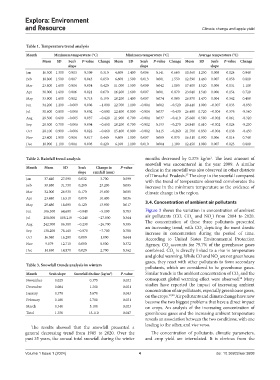
Table 1. Temperature trend analysis
Month Maximum temperature (°C) Minimum temperature (°C) Average temperature (°C)
Mean SD Sen’s P‑value Change Mean SD Sen’s P‑value Change Mean SD Sen’s P‑value Change
slope slope slope
Jan 16.500 1.300 0.003 0.509 0.310 4.600 1.400 0.006 0.141 0.660 10.560 1.250 0.008 0.024 0.940
Feb 18.800 1.500 0.007 0.043 0.850 6.600 1.500 0.013 0.001 1.550 12.590 1.460 0.007 0.058 0.810
Mar 23.800 1.600 0.004 0.034 0.420 11.000 1.500 0.009 0.042 1.080 17.400 1.520 0.009 0.031 1.100
Apr 30.000 1.600 0.006 0.021 0.670 16.200 1.600 0.007 0.001 0.870 23.040 1.540 0.006 0.154 0.720
May 33.900 1.600 0.002 0.718 0.190 20.200 1.400 0.007 0.074 0.800 26.970 1.470 0.004 0.342 0.490
Jun 34.200 1.200 −0.009 0.008 −1.000 22.700 1.100 −0.004 0.002 −0.520 28.440 1.090 −0.007 0.033 -0.850
Jul 30.600 0.800 −0.008 0.002 −0.890 22.400 0.800 −0.004 0.037 −0.430 26.490 0.720 −0.004 0.376 -0.540
Aug 29.500 0.600 −0.005 0.037 −0.620 21.900 0.700 −0.004 0.037 −0.410 25.680 0.580 −0.002 0.061 -0.320
Sep 29.500 0.700 −0.006 0.004 −0.650 20.200 0.700 −0.002 0.193 −0.270 24.840 0.610 −0.002 0.024 -0.230
Oct 28.100 0.900 −0.006 0.022 −0.660 15.400 0.900 −0.002 0.415 −0.260 21.700 0.850 −0.004 0.138 -0.450
Nov 23.400 1.000 0.004 0.017 0.440 9.600 1.000 0.007 0.000 0.870 16.510 0.900 0.006 0.014 0.740
Dec 18.900 1.100 0.004 0.003 0.420 6.100 1.100 0.010 0.004 1.100 12.450 1.080 0.007 0.023 0.800
Table 2. Rainfall trend analysis months decreased by 0.375 kg/m . The least amount of
2
snowfall was encountered in the year 2009. A similar
Month Mean SD Sen’s Change in P‑value decline in the snowfall was also observed in other districts
slope rainfall (mm) 27
Jan 37.440 27.590 0.032 3.700 0.599 of Himachal Pradesh. The drop in the snowfall compared
with the trend of temperature observed corroborates the
Feb 39.880 31.730 0.200 23.200 0.005 increase in the minimum temperature as the evidence of
Mar 32.000 26.930 0.170 19.600 0.005 climate change in the region.
Apr 23.440 16.510 0.090 10.400 0.036
May 29.480 18.690 0.120 13.900 0.017 3.4. Concentration of ambient air pollutants
Jun 106.300 64.690 −0.040 −5.100 0.783 Figure 3 shows the variation in concentration of ambient
Jul 258.000 108.210 −0.240 −27.800 0.364 air pollutants (CO, CO and NO ) from 2004 to 2020.
2,
x
Aug 242.900 86.380 −0.230 −26.700 0.305 The concentration of these three pollutants presented
an increasing trend, with CO depicting the most drastic
2
Sep 138.200 78.160 −0.070 −7.700 0.788 increase in concentration during the period of time.
Oct 16.040 16.290 0.080 1.000 0.644 According to United States Environmental Protection
Nov 9.079 12.710 0.000 0.000 0.372 Agency, CO accounts for 79.7% of the greenhouse gases
2
Dec 14.830 14.870 0.020 2.700 0.362 combined. CO is directly linked to a rise in temperature
2
and global warming. While CO and NO are not greenhouse
x
gases, they react with other pollutants to form secondary
Table 3. Snowfall trends analysis in winters
pollutants, which are considered to be greenhouse gases.
Month Sen’s slope Snowfall decline (kg/m ) P‑value Similar trends in the ambient concentration of CO and the
2
2
28
November −0.025 0.375 0.032 consequent global warming effect were observed. Many
December −0.084 1.260 0.021 studies have reported the impact of increasing ambient
January −0.378 5.670 0.043 concentration of air pollutants, especially greenhouse gases,
Air pollutants and climate change have now
on the crops.
29,30
February −0.180 2.700 0.031 become the two biggest problems that have a direct impact
March −0.340 5.100 0.023 on crops. An analysis of the increasing concentration of
Total −1.350 15.110 0.047 greenhouse gases and the increasing ambient temperature
reveals an association between the two conditions, with one
leading to the other, and vice versa.
The results showed that the snowfall presented a
general decreasing trend from 1985 to 2020. Over the The concentration of pollutants, climatic parameters,
past 35 years, the annual total snowfall during the winter and crop yield are interrelated. It is obvious from the
Volume 1 Issue 1 (2024) 4 doi: 10.36922/eer.3608