
Page 36 - EER-2-1
P. 36
Explora: Environment
and Resource Evaluating agricultural efficiency and sustainability
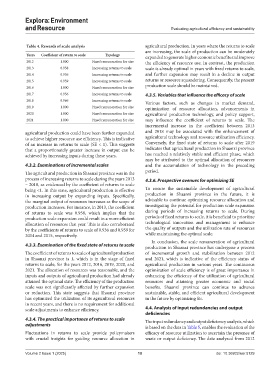
Table 4. Rewards of scale analysis agricultural production. In years where the returns to scale
are increasing, the scale of production can be moderately
Years Coefficient of return to scale Typology expanded to generate higher economic benefits and improve
2012 1.000 Fixed remuneration for size the efficiency of resource use. In contrast, the production
2013 0.958 Increasing returns to scale scale is already optimal in years with fixed returns to scale,
2014 0.936 Increasing returns to scale and further expansion may result in a decline in output
2015 0.959 Increasing returns to scale returns or resource squandering. Consequently, the present
2016 1.000 Fixed remuneration for size production scale should be maintained.
2017 0.956 Increasing returns to scale 4.3.5. Variables that influence the efficacy of scale
2018 0.966 Increasing returns to scale Various factors, such as changes in market demand,
2019 1.000 Fixed remuneration for size optimization of resource allocation, advancements in
2020 1.000 Fixed remuneration for size agricultural production technology, and policy support,
2021 1.000 Fixed remuneration for size may influence the coefficient of returns to scale. The
incremental increase in the coefficient between 2013
agricultural production could have been further expanded and 2018 may be associated with the enhancement of
to achieve higher resource use efficiency. This is indicative agricultural technology and resource utilization efficiency.
of an increase in returns to scale (SE < 1). This suggests Conversely, the fixed state of returns to scale after 2019
that a proportionately greater increase in output can be indicates that agricultural production in Shaanxi province
achieved by increasing inputs during these years. has reached a relatively stable and efficient phase, which
may be attributed to the optimal allocation of resources
4.3.2. Examinations of incremental scales and the accumulation of technology in the preceding
The agricultural production in Shaanxi province was in the period.
process of increasing returns to scale during the years 2013 4.3.6. Prospective avenues for optimizing SE
– 2018, as evidenced by the coefficient of returns to scale
being <1. In this state, agricultural production is effective To ensure the sustainable development of agricultural
in increasing output by expanding inputs. Specifically, production in Shaanxi province in the future, it is
the marginal output of resources increases as the scope of advisable to continue optimizing resource allocation and
production increases. For instance, in 2013, the coefficient investigating the potential for production scale expansion
of returns to scale was 0.958, which implies that the during periods of increasing returns to scale. During
production scale expansion could result in a more efficient periods of fixed returns to scale, it is beneficial to prioritize
allocation of resources that year. This is also corroborated technological innovation and management to enhance
by the coefficients of returns to scale of 0.936 and 0.959 for the quality of outputs and the utilization rate of resources
2014 and 2015, respectively. while maintaining the optimal scale.
In conclusion, the scale remuneration of agricultural
4.3.3. Examination of the fixed state of returns to scale production in Shaanxi province has undergone a process
The coefficient of returns to scale of agricultural production of incremental growth and stabilization between 2012
in Shaanxi province is 1, which is in the stage of fixed and 2021, which is indicative of the efficiency status of
returns to scale, for the years 2012, 2016, 2019, 2020, and agricultural production in various years. The continuous
2021. The allocation of resources was reasonable, and the optimization of scale efficiency is of great importance in
inputs and outputs of agricultural production had already enhancing the efficiency of the utilization of agricultural
attained the optimal state. The efficiency of the production resources and attaining greater economic and social
scale was not significantly affected by further expansion benefits. Shaanxi province can continue to advance
or reduction. This state suggests that Shaanxi province sustainable, stable, and efficient agricultural development
has optimized the utilization of its agricultural resources in the future by optimizing SE.
in recent years, and there is no requirement for additional
scale adjustments to enhance efficiency. 4.4. Analysis of input redundancies and output
deficiencies
4.3.4. The practical importance of returns to scale The input redundancy and output deficiency analysis, which
adjustments is based on the data in Table 5, enables the evaluation of the
Fluctuations in returns to scale provide policymakers efficacy of resource utilization to ascertain the presence of
with crucial insights for guiding resource allocation in waste or output deficiency. The data analyzed from 2012
Volume 2 Issue 1 (2025) 10 doi: 10.36922/eer.5129