
Page 37 - EER-2-1
P. 37
Explora: Environment
and Resource Evaluating agricultural efficiency and sustainability
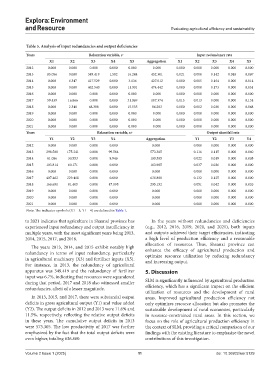
Table 5. Analysis of input redundancies and output deficiencies
Years Relaxation variable, s − Input redundancy rate
X1 X2 X3 X4 X5 Aggregation X1 X2 X3 X4 X5
2012 0.000 0.000 0.000 0.000 0.000 0.000 0.000 0.000 0.000 0.000 0.000
2013 85.056 0.000 349.419 1.582 16.244 452.301 0.021 0.000 0.142 0.018 0.067
2014 0.000 6.347 417.529 0.000 3.136 427.012 0.000 0.005 0.164 0.000 0.014
2015 0.000 0.000 462.540 0.000 11.901 474.442 0.000 0.000 0.173 0.000 0.051
2016 0.000 0.000 0.000 0.000 0.000 0.000 0.000 0.000 0.000 0.000 0.000
2017 59.439 16.866 0.000 0.000 31.069 107.374 0.015 0.013 0.000 0.000 0.134
2018 0.000 2.340 68.388 0.000 15.555 86.283 0.000 0.002 0.030 0.000 0.068
2019 0.000 0.000 0.000 0.000 0.000 0.000 0.000 0.000 0.000 0.000 0.000
2020 0.000 0.000 0.000 0.000 0.000 0.000 0.000 0.000 0.000 0.000 0.000
2021 0.000 0.000 0.000 0.000 0.000 0.000 0.000 0.000 0.000 0.000 0.000
Years Relaxation variable, s+ Output shortfall rate
Y1 Y2 Y3 Y4 Aggregation Y1 Y2 Y3 Y4
2012 0.000 0.000 0.000 0.000 0.000 0.000 0.000 0.000 0.000
2013 298.500 175.241 0.000 99.564 573.305 0.116 0.115 0.000 0.060
2014 61.086 30.553 0.000 8.946 100.585 0.022 0.019 0.000 0.005
2015 103.814 60.171 0.000 0.000 163.985 0.037 0.036 0.000 0.000
2016 0.000 0.000 0.000 0.000 0.000 0.000 0.000 0.000 0.000
2017 407.462 229.418 0.000 0.000 636.880 0.132 0.125 0.000 0.000
2018 166.651 81.405 0.000 47.095 295.152 0.051 0.042 0.000 0.026
2019 0.000 0.000 0.000 0.000 0.000 0.000 0.000 0.000 0.000
2020 0.000 0.000 0.000 0.000 0.000 0.000 0.000 0.000 0.000
2021 0.000 0.000 0.000 0.000 0.000 0.000 0.000 0.000 0.000
Note: The indicator symbols (X1 – 5, Y1 – 4) are defined in Table 1.
to 2021 indicates that agriculture in Shaanxi province has In the years without redundancies and deficiencies
experienced input redundancy and output insufficiency in (e.g., 2012, 2016, 2019, 2020, and 2021), both inputs
multiple years, with the most significant years being 2013, and outputs achieved their target efficiencies, indicating
2014, 2015, 2017, and 2018. a high level of production efficiency and a reasonable
allocation of resources. Thus, Shaanxi province can
The years 2013, 2014, and 2015 exhibit notably high
redundancy in terms of input redundancy, particularly enhance the efficacy of agricultural production and
optimize resource utilization by reducing redundancy
in agricultural machinery (X3) and fertilizer inputs (X5). and increasing output.
For instance, in 2013, the redundancy of agricultural
apparatus was 349.419 and the redundancy of fertilizer 5. Discussion
input was 6.7%, indicating that resources were squandered
during that period. 2017 and 2018 also witnessed smaller SLM is significantly influenced by agricultural production
redundancies, albeit of a lesser magnitude. efficiency, which has a significant impact on the efficient
utilization of resources and the development of rural
In 2013, 2015, and 2017, there were substantial output areas. Improved agricultural production efficiency not
deficits in gross agricultural output (Y1) and value added only optimizes resource allocation but also promotes the
(Y2). The output deficits in 2012 and 2013 were 11.6% and sustainable development of rural economies, particularly
11.5%, respectively, reflecting the relative output deficits in resource-constrained rural areas. In this section, we
in these years. The cumulative output deficits in 2013 focus on the role of agricultural production efficiency in
were 573.305. The low productivity of 2017 was further the context of SLM, providing a critical comparison of our
emphasized by the fact that the total output deficits were findings with the existing literature to emphasize the novel
even higher, totaling 636.880. contributions of this investigation.
Volume 2 Issue 1 (2025) 11 doi: 10.36922/eer.5129