
Page 33 - EER-2-1
P. 33
Explora: Environment
and Resource Evaluating agricultural efficiency and sustainability
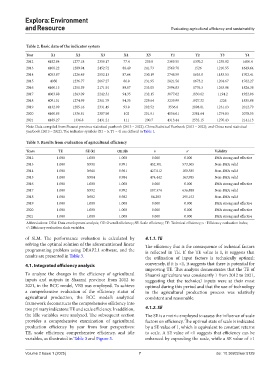
Table 2. Basic data of the indicator system
Year X1 X2 X3 X4 X5 Y1 Y2 Y3 Y4
2012 4182.84 1277.18 2350.17 77.4 239.8 2309.55 1370.2 1255.92 1600.4
2013 4108.22 1209.94 2452.72 88.49 241.73 2569.78 1526 1210.55 1649.64
2014 4053.87 1226.49 2552.13 87.64 230.19 2748.59 1635.8 1183.53 1702.41
2015 4050 1236.77 2667.27 86.8 231.95 2821.56 1673.2 1204.67 1762.27
2016 4160.15 1251.39 2171.91 89.87 233.05 2994.83 1776.3 1263.96 1826.38
2017 4063.88 1263.09 2242.51 94.35 232.15 3077.62 1830.62 1194.2 1922.06
2018 4091.01 1274.99 2311.79 94.35 229.64 3239.99 1927.32 1226 1835.08
2019 4132.09 1285.16 2331.49 93.8 202.52 3536.8 2098.01 1231.13 2012.79
2020 4160.85 1336.81 2387.96 102 201.91 4056.61 2381.64 1274.83 2070.55
2021 4189.27 1336.8 2431.21 111 200.7 4313.44 2532.15 1270.43 2141.13
Note: Data compiled from Shaanxi province statistical yearbook (2013 – 2022), China Statistical Yearbook (2013 – 2022), and China rural statistical
yearbook (2013 – 2022). The indicator symbols (X1 – 5, Y1 – 4) are defined in Table 1.
Table 3. Results from evaluation of agricultural efficiency
Years TE SE (k) OE (θ) s − s + Validity
2012 1.000 1.000 1.000 0.000 0.000 DEA strong and effective
2013 1.000 0.991 0.991 452.301 573.305 Non-DEA valid
2014 1.000 0.961 0.961 427.012 100.585 Non-DEA valid
2015 1.000 0.984 0.984 474.442 163.985 Non-DEA valid
2016 1.000 1.000 1.000 0.000 0.000 DEA strong and effective
2017 1.000 0.992 0.992 107.374 636.880 Non-DEA valid
2018 1.000 0.982 0.982 86.283 295.152 Non-DEA valid
2019 1.000 1.000 1.000 0.000 0.000 DEA strong and effective
2020 1.000 1.000 1.000 0.000 0.000 DEA strong and effective
2021 1.000 1.000 1.000 0.000 0.000 DEA strong and effective
Abbreviations: DEA: Data envelopment analysis; OE: Overall efficiency; SE: Scale efficiency; TE: Technical efficiency; s : Efficiency evaluation index;
−
s : Efficiency evaluation slack variables.
+
of SLM. The performance evaluation is calculated by 4.1.1. TE
solving the optimal solution of the aforementioned linear The efficiency that is the consequence of technical factors
programming problem using DEAP2.1 software, and the is reflected in TE. If the TE value is 1, it suggests that
results are presented in Table 3. the utilization of input factors is technically optimal;
4.1. Integrated efficiency analysis conversely, if it is <1, it suggests that there is potential for
improving TE. This analysis demonstrates that the TE of
To analyze the changes in the efficiency of agricultural Shaanxi agriculture was consistently 1 from 2012 to 2021,
inputs and outputs in Shaanxi province from 2012 to suggesting that the technical inputs were at their most
2021, in the BCC model, VRS was employed. To achieve optimal during this period and that the use of technology
a comprehensive evaluation of the efficiency status of in the agricultural production process was relatively
agricultural production, the BCC model’s analytical consistent and reasonable.
framework deconstructs the comprehensive efficiency into
two primary indicators: TE and scale efficiency. In addition, 4.1.2. SE
the idle variables were analyzed. The subsequent section The SE is a metric employed to assess the influence of scale
provides a comprehensive examination of agricultural factors on efficiency. The optimal state of scale is indicated
production efficiency by year from four perspectives: by a SE value of 1, which is equivalent to constant returns
TE, scale efficiency, comprehensive efficiency, and idle to scale. A SE value of <1 suggests that efficiency can be
variables, as illustrated in Table 3 and Figure 3. enhanced by expanding the scale, while a SE value of >1
Volume 2 Issue 1 (2025) 7 doi: 10.36922/eer.5129