
Page 34 - EER-2-1
P. 34
Explora: Environment
and Resource Evaluating agricultural efficiency and sustainability
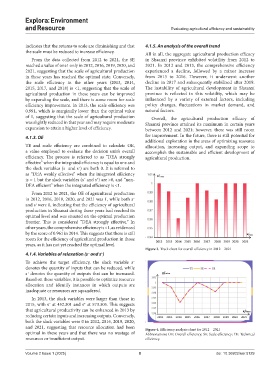
indicates that the returns to scale are diminishing and that 4.1.5. An analysis of the overall trend
the scale must be reduced to increase efficiency. All in all, the aggregate agricultural production efficacy
From the data collected from 2012 to 2021, the SE in Shaanxi province exhibited volatility from 2012 to
reached a value of one1 only in 2012, 2016, 2019, 2020, and 2021. In 2012 and 2013, the comprehensive efficiency
2021, suggesting that the scale of agricultural production experienced a decline, followed by a minor increase
in these years has reached the optimal state. Conversely, from 2013 to 2016. However, it underwent another
the scale efficiency in the other years (2013, 2014, decline in 2017 and subsequently stabilized after 2019.
2015, 2017, and 2018) is <1, suggesting that the scale of The instability of agricultural development in Shaanxi
agricultural production in these years can be improved province is reflected in this volatility, which may be
by expanding the scale, and there is some room for scale influenced by a variety of external factors, including
efficiency improvement. In 2013, the scale efficiency was policy changes, fluctuations in market demand, and
0.991, which is marginally lower than the optimal value natural factors.
of 1, suggesting that the scale of agricultural production Overall, the agricultural production efficacy of
was slightly reduced in that year and may require moderate Shaanxi province attained its maximum in certain years
expansion to attain a higher level of efficiency. between 2012 and 2021; however, there was still room
4.1.3. OE for improvement. In the future, there is still potential for
additional exploration in the areas of optimizing resource
TE and scale efficiency are combined to calculate OE, allocation, increasing output, and expanding scope to
a value employed to evaluate the decision unit’s overall accomplish the sustainable and efficient development of
efficiency. The process is referred to as “DEA strongly agricultural production.
effective” when the integrated efficiency is equal to one and
the slack variables (s and s ) are both 0. It is referred to
+
−
as “DEA weakly effective” when the integrated efficiency
is = 1 but the slack variables (s and s ) are >0, and “non-
+
−
DEA efficient” when the integrated efficiency is <1.
From 2012 to 2021, the OE of agricultural production
in 2012, 2016, 2019, 2020, and 2021 was 1, while both s
−
and s were 0, indicating that the efficiency of agricultural
+
production in Shaanxi during these years had reached its
optimal level and was situated on the optimal production
frontier. This is considered “DEA strongly effective.” In
other years, the comprehensive efficiency is <1, as evidenced
by the score of 0.961 in 2014. This suggests that there is still
room for the efficiency of agricultural production in those
years, as it has not yet reached the optimal level.
Figure 3. Track chart for overall efficiency in 2012 – 2021
4.1.4. Variables of relaxation (s and s )
−
+
To achieve the target efficiency, the slack variable s
−
denotes the quantity of inputs that can be reduced, while
s denotes the quantity of outputs that can be increased.
+
Based on these variables, it is possible to optimize resource
allocation and identify instances in which outputs are
inadequate or resources are squandered.
In 2013, the slack variables were larger than those in
2015, with s at 452.301 and s at 573.305. This suggests
+
−
that agricultural productivity can be enhanced in 2013 by
reducing certain inputs and increasing outputs. Conversely,
both the slack variables were 0 in 2012, 2016, 2019, 2020,
and 2021, suggesting that resource allocation had been Figure 4. Efficiency analysis chart for 2012 – 2021
optimal in these years and that there was no wastage of Abbreviations: OE: Overall efficiency; SE: Scale efficiency; TE: Technical
resources or insufficient output. efficiency.
Volume 2 Issue 1 (2025) 8 doi: 10.36922/eer.5129