
Page 12 - EER-2-3
P. 12
Explora: Environment
and Resource Environmental contamination of titanium
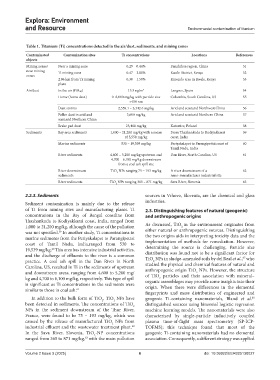
Table 1. Titanium (Ti) concentrations detected in the air/dust, sediments, and mining zones
Contaminated Contamination sites Ti concentrations Locations References
objects
Mining zones/ Near a mining zone 0.29 – 0.44% Panzhihua region, China 51
near mining Ti mining zone 0.47 – 2.80% Kwale District, Kenya 52
zones
2.86 km from Ti mining 0.30 – 1.50% Kinondo area in Kwale, Kenya 53
plant
Air/dust In the air (PM10) 15.3 ng/m 3 Langreo, Spain 54
Home (home dust) 0–8,000 mg/kg with particle size Columbia, South Carolina, US 55
>450 nm
Dust storms 2,558.1 – 3,342.6 mg/kg Arid and semiarid Northwest China 56
Fallen dust in arid and 3,600 mg/kg Arid and semiarid Northern China 57
semiarid Northern China
Brake pad dust 25,400 mg/kg Katowice, Poland 58
Sediments Bay area sediments 1,000 – 21,200 mg/kg with a mean From Thazhankuda to Kodiyakkarai 59
of 5,550 mg/kg coast, India
Marine sediments 530 – 19,539 mg/kg Periyakalapet to Parangipettai coast of 60
Tamil Nadu, India
River sediments 4,600 – 5,200 mg/kg upstream and Dan River, North Carolina, US 61
4,700 – 6,100 mg/kg downstream
from a coal ash spill site
River downstream TiO NPs ranging 75 – 193 mg/kg A river downstream of a 62
2
sediments nano-manufacturer industrial site
River sediments TiO NPs ranging 365 – 871 mg/kg Sava River, Slovenia 63
2
2.2.3. Sediments sources in Vrhovo, Slovenia, are the chemical and glass
Sediment contamination is mainly due to the release industries.
of Ti from mining sites and manufacturing plants. Ti 2.3. Distinguishing features of natural (geogenic)
concentrations in the Bay of Bengal coastline from and anthropogenic origins
Thazhankuda to Kodiyakkarai coast, India, ranged from
1,000 to 21,200 mg/kg, although the cause of the pollution As discussed, TiO in the environment originates from
2
was not specified. In another study, Ti concentrations in either natural or anthropogenic sources. Distinguishing
59
marine sediments from the Periyakalapet to Parangipettai the two origins aids in interpreting toxicity data and the
coast of Tamil Nadu, India,ranged from 530 to implementation of methods for remediation. However,
19,539 mg/kg. This area has intensive industrial activities, determining the source is challenging. Particle size
60
and the discharge of effluents to the river is a common distribution was found not to be a significant factor for
67
practice. A coal ash spill in the Dan River in North TiO NPs in sludge-amended soils by del Real et al., who
2
studied the physical and chemical features of natural and
Carolina, US, resulted in Ti in the sediments of upstream anthropogenic origin TiO NPs. However, the structure
and downstream areas, ranging from 4,600 to 5,200 mg/ of TiO particles and their association with mineral–
2
kg and 4,700 to 6,100 mg/kg, respectively. This type of spill organic assemblages may provide some insights into their
2
is significant as Ti concentrations in the sediments were origin. When there were differences in the elemental
similar to those in coal ash. 61
fingerprints and mass distribution of engineered and
In addition to the bulk form of TiO , TiO NPs have geogenic Ti-containing nanomaterials, Bland et al.
68
2
2
been detected in sediments. The concentrations of TiO distinguished sources using binomial logistic regression
2
NPs in the sediment downstream of the Thur River, machine learning models. The nanomaterials were also
France, were found to be 75 – 193 mg/kg, which was characterized by single-particle inductively coupled
caused by the release of manufactured TiO NPs from plasma time-of-flight mass spectrometry (SP-ICP-
2
industrial effluent and the wastewater treatment plant. TOFMS); this technique found that most of the
62
In the Sava River, Slovenia, TiO -NP concentrations geogenic Ti-containing nanomaterials had no elemental
2
ranged from 365 to 871 mg/kg, with the main pollution association. Consequently, a different strategy was applied
63
Volume 2 Issue 3 (2025) 6 doi: 10.36922/EER025130027