
Page 14 - EER-2-3
P. 14
Explora: Environment
and Resource Environmental contamination of titanium
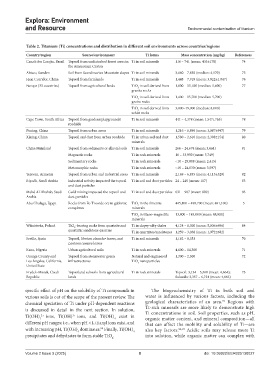
Table 2. Titanium (Ti) concentrations and distribution in different soil environments across countries/regions
Country/region Source/environment Ti forms Mass concentration (mg/kg) References
Canaã dos Carajàs, Brazil Topsoil from undisturbed forest areas in Ti in soil minerals 116 – 741 (mean: 433±178) 74
the Amazonian Craton
Abisco, Sweden Soil from Scandinavian Mountain slopes Ti in soil minerals 3,660 – 7,830 (median: 4,170) 75
Hexi Corridor, China Topsoil from farmlands Ti in soil minerals 1,448 – 7,919 (mean: 3,022±1,047) 76
Europe (33 countries) Topsoil from agricultural lands TiO in soil derived from 1,800 – 55,100 (median: 5,600) 77
2
granite rocks
TiO in soil derived from 1,400 – 15,700 (median: 5,700)
2
gneiss rocks
TiO in soil derived from 3,000–19,900 (median: 8,000)
2
schist rocks
Cape Town, South Africa Topsoil from gardens/playgrounds/ Ti in soil minerals 441 – 4,378 (mean: 1,547±765) 78
roadside
Puning, China Topsoil from urban areas Ti in soil minerals 1,216 – 6,896 (mean: 3,087±947) 79
Xining, China Topsoil and dust from urban roadside Ti in urban soil and dust 1,580 – 2,610 (mean: 2,308±154) 80
minerals
China Mainland Topsoil from sediments or alluvial soils Ti in soil minerals 266 – 24,674 (mean: 3,661) 81
Magmatic rocks Ti in rock minerals 16 – 33,950 (mean: 3,749)
Sedimentary rocks Ti in rock minerals <10 – 29,888 (mean: 2,415)
Metamorphic rocks Ti in rock minerals <10 – 24,030 (mean: 3,597)
Yerevan, Armenia Topsoil from urban and industrial areas Ti in soil minerals 2,169 – 6,835 (mean: 4,115±529) 82
Riyadh, Saudi Arabia Industrial activity impacted the topsoil Ti in soil and dust particles 24 – 240 (mean: 117) 83
and dust particles
Mahd Al Dhahab, Saudi Gold mining impacted the topsoil and Ti in soil and dust particles 631 – 987 (mean: 809) 83
Arabia dust particles
Abu Ghalaga, Egypt Rocks from Fe-Ti oxide ore in gabbroic TiO in the ilmenite 445,100 – 490,700 (mean: 481,100) 5
2
complexes minerals
TiO in titano-magnetite 13,800 – 185,000 (mean: 88,800)
2
minerals
Wiśniówka, Poland TiO -bearing rocks from quartzite and Ti in clayey-silty shales 4,124 – 6,300 (mean: 5,036±696) 84
2
quartzitic sandstone quarries Ti in quartzites/sandstones 1,259 – 3,038 (mean: 1,972±682)
Seville, Spain Topsoil, Nerium oleander leaves, and Ti in soil minerals 1,162 – 8,353 70
Lantana camara leaves
Kano, Nigeria Urban agricultural soils Ti in rock minerals 4,600 – 14,300 71
Orange County and Topsoil from stormwater green Natural and engineered 1,300 – 2,500 72
Los Angeles, California, infrastructures TiO nanoparticles
2
United State
Frydek-Mistek, Czech Topsoiland subsoils from agricultural Ti in rock minerals Topsoil: 3,134 – 5,560 (mean: 4,664); 73
Republic lands Subsoils: 3,357 – 6,724 (mean: 4,863)
specific effect of pH on the solubility of Ti compounds in The biogeochemistry of Ti in both soil and
various soils is out of the scope of the present review. The water is influenced by various factors, including the
91
chemical speciation of Ti under pH-dependent reactions geological characteristics of an area. Regions with
is discussed in detail in the next section. In solution, Ti-rich minerals are more likely to demonstrate high
Ti(OH) 2 2+ ions, Ti(OH) 3+ ions, and Ti(OH) exist in Ti concentrations in soil. Soil properties, such as pH,
organic matter content, and mineral composition—all
4
different pH ranges; i.e., when pH <1, titanyl ions exist, and that can affect the mobility and solubility of Ti—are
with increasing pH, Ti(OH) dominates. Finally, Ti(OH) also key factors. 92,93 Acidic soils may release more Ti
90
4
4
precipitates and dehydrates to form stable TiO . into solution, while organic matter can complex with
2
Volume 2 Issue 3 (2025) 8 doi: 10.36922/EER025130027