
Page 224 - EJMO-9-1
P. 224
Eurasian Journal of Medicine and
Oncology
Psoas muscle and atherosclerotic inflammation
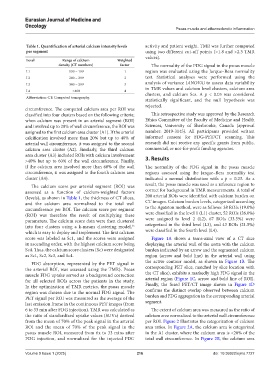
Table 1. Quantification of arterial calcium intensity levels activity and patient weight. TMR was further computed
per segment using two different cut-off points (>1.8 and >2.3 TMR
values).
Level Range of calcium Weighted
density (CT numbers) factor The normality of the FDG signal in the psoas muscle
L1 130 – 199 1 region was evaluated using the Jarque–Bera normality
L2 200 – 299 2 test. Statistical analyses were performed using the
L3 300 – 399 3 analysis of variance (ANOVA) to assess data variability
in TMR values and calcium level clusters, calcium area
L4 >400 4 clusters, and calcium Scs. A p < 0.05 was considered
Abbreviation: CT: Computed tomography.
statistically significant, and the null hypothesis was
rejected.
circumference. The computed calcium area per ROI was
classified into four clusters based on the following criteria: This retrospective study was approved by the Research
when calcium was present in an arterial segment (ROI) Ethics Committee of the Faculty of Medicine and Health
and involved up to 20% of wall circumference, the ROI was Sciences, University of Sherbrooke, Canada (approval
assigned to the first calcium area cluster (A1). If the arterial number: 2019-3145). All participants provided written
calcification involved more than 20% but up to 40% of informed consent for FDG-PET/CT scanning. This
arterial wall circumference, it was assigned to the second research did not receive any specific grants from public,
calcium area cluster (A2). Similarly, the third calcium commercial, or not-for-profit funding agencies.
area cluster (A3) included ROIs with calcium involvement
>40% but up to 60% of the wall circumference. Finally, 3. Results
if the calcium area involved more than 60% of the wall The normality of the FDG signal in the psoas muscle
circumference, it was assigned to the fourth calcium area regions assessed using the Jarque–Bera normality test
cluster (A4). indicated a normal distribution with a p = 0.23. As a
The calcium score per arterial segment (ROI) was result, the psoas muscle was used as a reference region to
assessed as a function of calcium-weighted factors correct for background in TMR measurements. A total of
(levels), as shown in Table 1, the thickness of CT slices, 200 arterial ROIs were identified with calcium burden on
and the calcium area normalized to the total wall CT images. Calcium burden levels, categorized according
circumference per ROI. The calcium score per segment to the Agatston method, were as follows: 38 ROIs (19.0%)
(ROI) was therefore the result of multiplying these were classified in the level 1 (L1) cluster, 52 ROIs (26.0%)
parameters. The calcium score data were then clustered were assigned to level 2 (L2), 67 ROIs (33.5%) were
into four clusters using a k-means clustering model, categorized in the third level (L3), and 43 ROIs (21.5%)
25
which is easy to deploy and implement. The first calcium were classified in the fourth level (L4).
score was labeled as Sc1, and the scores were assigned Figure 1A shows a trans-axial view of a CT slice
in ascending order, with the highest calcium score being displaying the arterial wall of the aorta with the calcium
Sc4. Thus, the calcium score clusters (Sc) were designated burden indicated by an arrow and the segmented calcium
as Sc1, Sc2, Sc3, and Sc4. region (arrow and bold line) in the arterial wall using
FDG absorption, represented by the PET signal in the active contour model, as shown in Figure 1B. The
the arterial ROI, was assessed using the TMR). Psoas corresponding PET slice, matched by slice location with
muscle FDG uptake served as a background correction the CT slice), exhibits a markedly high FDG signal in the
for all selected ROIs across the patients in the study. arterial region (Figure 1C, arrow and bold line of ROI).
In the optimization of TMR metrics, the psoas muscle Finally, the fused PET/CT image shown in Figure 1D
region was chosen due to the normal FDG signal. The confirms the distinct overlap observed between calcium
PET signal per ROI was measured as the average of the burden and FDG aggregation in the corresponding arterial
last emission frame in the continuous PET images (from segment.
6 to 33 min after FDG injection). TMR was calculated as The extent of calcium area was measured as the ratio of
the ratio of standardized uptake values (SUVs) derived calcium area normalized to the arterial wall circumference
from the mean of 70% of the peak signal in the arterial per ROI. Figure 2 illustrates the categorization of calcium
ROI and the mean of 70% of the peak signal in the area ratios. In Figure 2A, the calcium area is categorized
psoas muscle ROI, measured from 6x to 33 mins after in the A1 cluster, where the calcium area is <20% of the
FDG injection, and normalized for the injected FDG total wall circumference. In Figure 2B, the calcium area
Volume 9 Issue 1 (2025) 216 doi: 10.36922/ejmo.7727